Analyzing A/B Test Results
Statistical Analysis Table
Once your A/B test has run and enough data has been collected, the Statistical Analysis table provides a summary of how each variant performed–so you can confidently interpret the results.
| Users Exposed | Number of users assigned to each variant during the test. |
| Goal Metrics | The average value of your chosen Goal Metric (e.g. Playtime per User) across the duration of your experiment. |
| Best Odds | The probability that the variant is the best performer for the selected variant. |
| Gain Over Control | Estimated difference between the variant and the control, expressed as a percentage range. |
| Distribution | The full distribution of your chosen Goal Metrics (e.g. Playtime per User) across the duration of your experiment. |
| Winner Label | The variant with the highest probability of being the best performer is labeled “Winner”. |
Statistical Methods Used
To make sure A/B test results are reliable, we use two well-established statistical methods.
| Bayesian Inference | Helps estimate which variant is likely to be the best, even when the sample sizes are small. It is especially useful when testing with early or limited data. |
| Bootstrapping | Used with a large number of users. It allows us to simulate many possible outcomes from the data to understand how confident we can be in the results. |
Both methods help calculate:
- Best Odds: How likely each variant is to be the best (Best Odds)
- Gain over Control: The expected gain over the control group
Metrics Data
You can further analyze your A/B test results with a time series chart that visualizes how the selected Goal Metric (e.g. Playtime per User) evolved for each variant over the duration of the test.
- X-Axis: Date
- Y-Axis: Selected metric value (e.g. playtime, ARPPU)
- Lines: Each test variant is plotted as a separate colored line (e.g., blue for control, yellow for Variant 1)
Use this to:
- Observe trends over time for your A/B test groups
- Check for early differences between groups
- Spot any anomalies or inconsistencies in daily performance
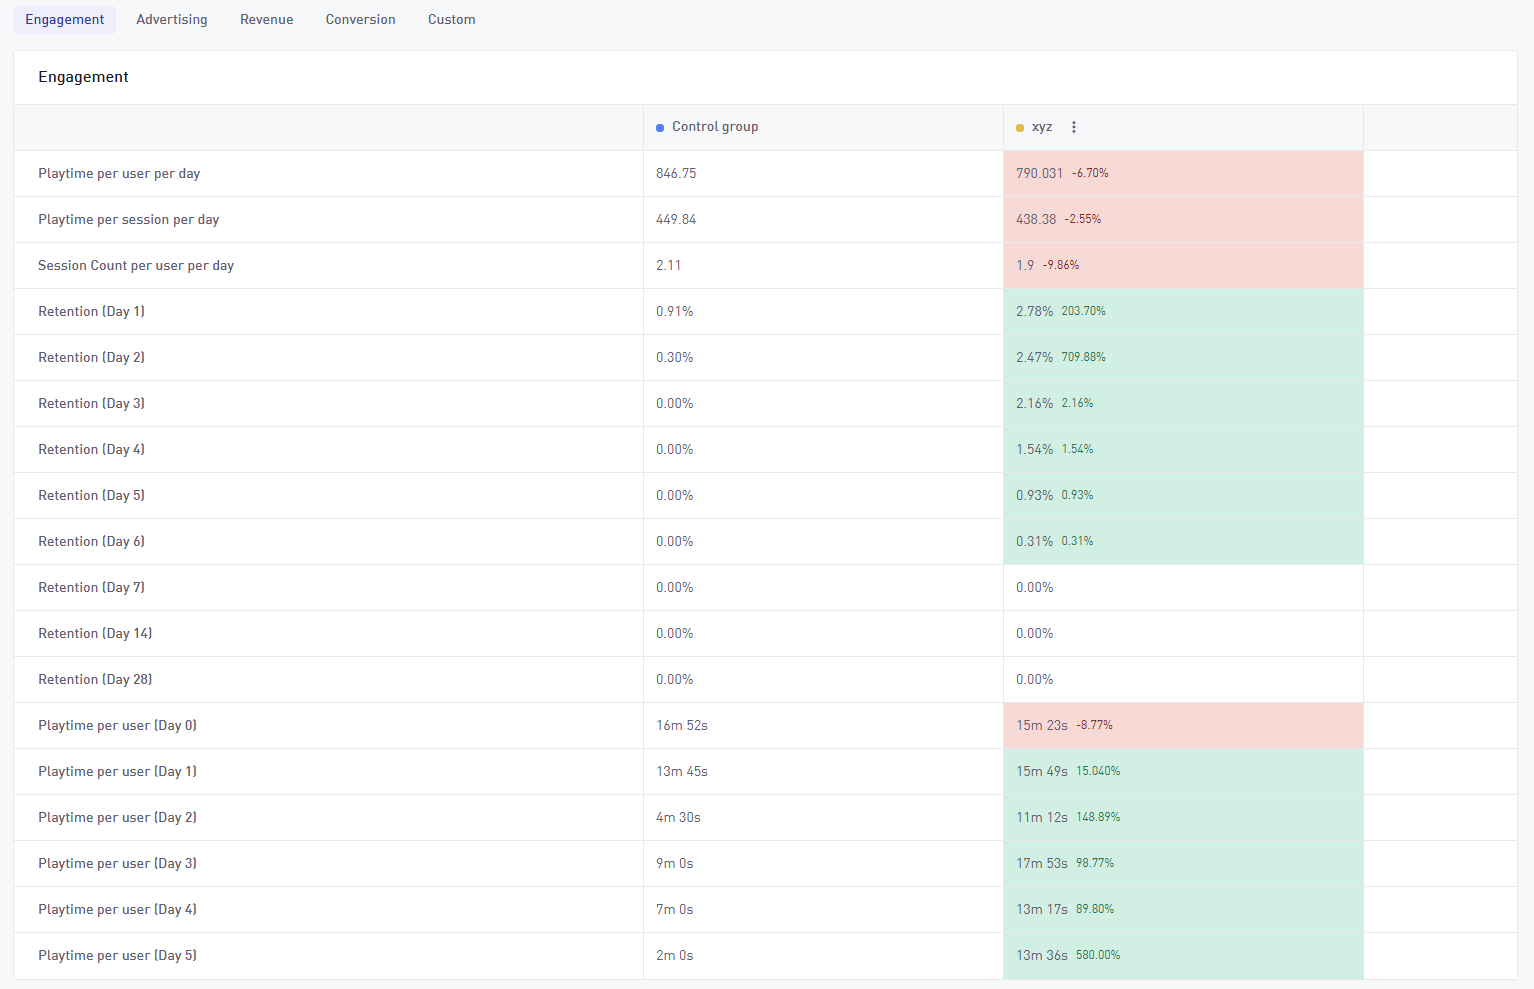
Results Table
You can also look at an extended list of metrics calculated during the A/B test, including:
- Engagement: Retention (D1, D3, D7, etc.), playtime, sessions
- Advertising: Ad revenue, impressions, clicks, views
- Revenue: IAP, ARPU, ARPPU, Cumulative Revenue
- Conversion: Conversion rate, PUR
- Custom: Customize your results tab with multiple metrics