How it works
This documentation describes the legacy version of the Explore Tool. We've built a new and improved version in our latest iteration of the web-tool. To find out more about this please check out our new Explore Tool article.
Explore is an enhanced, isolated workbench for your data.
With it you can:
- View core metrics, event metrics and custom metrics tracked by the GameAnalytics servers
- Change visualisation options
- Apply filtering
- Export data to CSV
Select any predefined core and custom metrics to visualize them as you see fit. After selecting your metrics, pick the aggregation, visualisation methods and filters that you want. Note that depending on the metric, the aggregations methods you can chose will be limited.
Event Metrics
Win/loss ratios are great ways to figure out how players are progressing through the game, but what if you want to tell how many times players performed a certain action in a level?
You can now easily get this information by using events as metrics.
Combined with filtering and splitting, this will enable you to compare the rate at which certain actions are triggered by users who start a specific level.
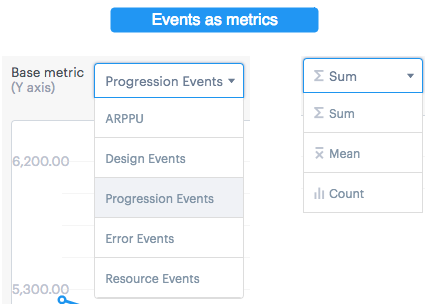
- Any event type (business, design, error, progression, resources) can be used as a metric.
- Filters can be used to select a specific – or a combination of – events you want to measure
- Some event types include numerical values, such as scores, virtual currency counts, etc., and sum and mean calculations can be applied to them. Events without numerical values attached won’t show a sum or mean, but you can get their count.
Using Filters
Our filtering feature lets you look at your data however you want, so that you can answer those tricky questions like; How does my retention in the USA compare to that in the UK? Which devices have the highest win percentages in my game? Or Which levels are being completed or failed the most?
In short, filters can be used to select a specific – or a combination of – events or dimensions that you want to measure.
Let's now jump into how to build them!
Filtering works by picking a dimension, event, or config type, and then fine tuning the specific values on what you want to see (like only viewing Tutorial events).
Here are a few steps to building yourself a filter, we will use the example of filtering by progression events:
-
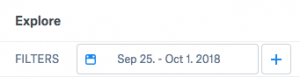
Click on the ‘+ Filters’ icon on the filter bar, next to the date picker.
-
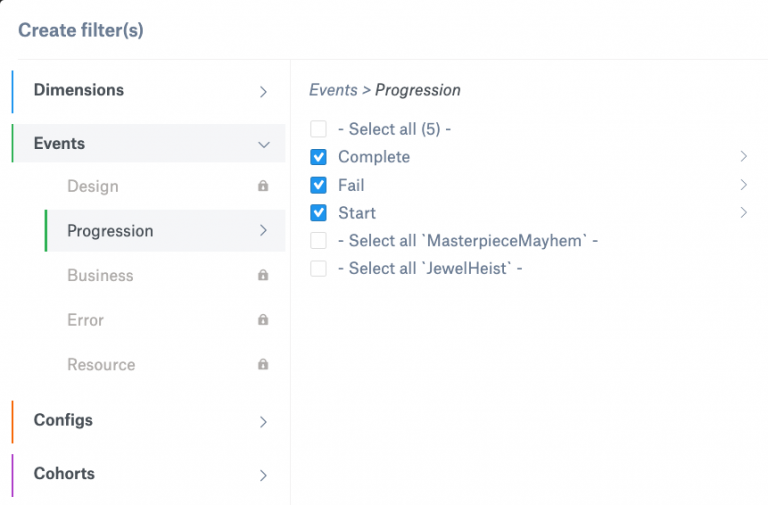
Let the filter picker load (no more than a few seconds). Once loaded, you’ll then see a few options for Dimensions, Events, or Configs. For this example, we will pick Events.
-
Under the events tab let's select Progression. You can select the Progression events of your choice such as Level Fails and Level Completes. Here we have selected, Complete, Fail and Start events. Once the events are selected hit apply!
-
Next, access the Split drop down list on the top right hand corner of the page to split by the number of progression events you have selected, this would provide a breakdown of each progression event. In this example three events were selected:
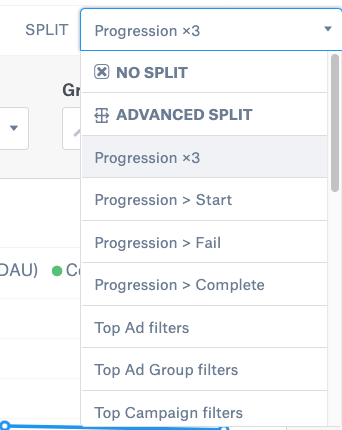
You will then able to visualised the filtered events we have selected as shown below:
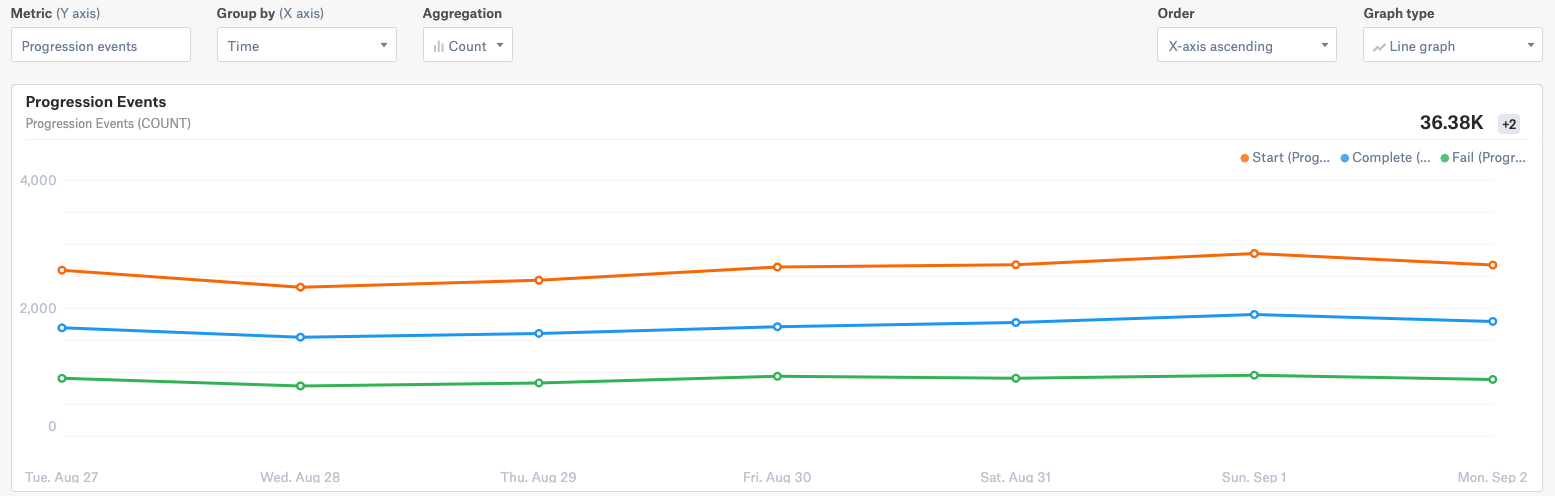
Graph Options
There are several ways in which you can manipulate your data when visualising it. Depending on the data, you can choose to look at it as a timeline, dimension – if any is selected – or value, if a dimension or event is chosen.
The toolbar above the graph allows for tweaking the data plotted. You can sort by either the x or y-axis, the values displayed or de- or ascending.
If displaying unit-like values on the two y-axis, Explore allows you to pair these to make the graph more readable.
Comparing Metrics
Seeing how many times users triggered an event is great, but to get the full story you also need to know how that behaviour impacts other metrics.
Do players who meet a special character convert better or worse? How does that change for each character type they meet? These questions can be with Explore’s comparison mode.
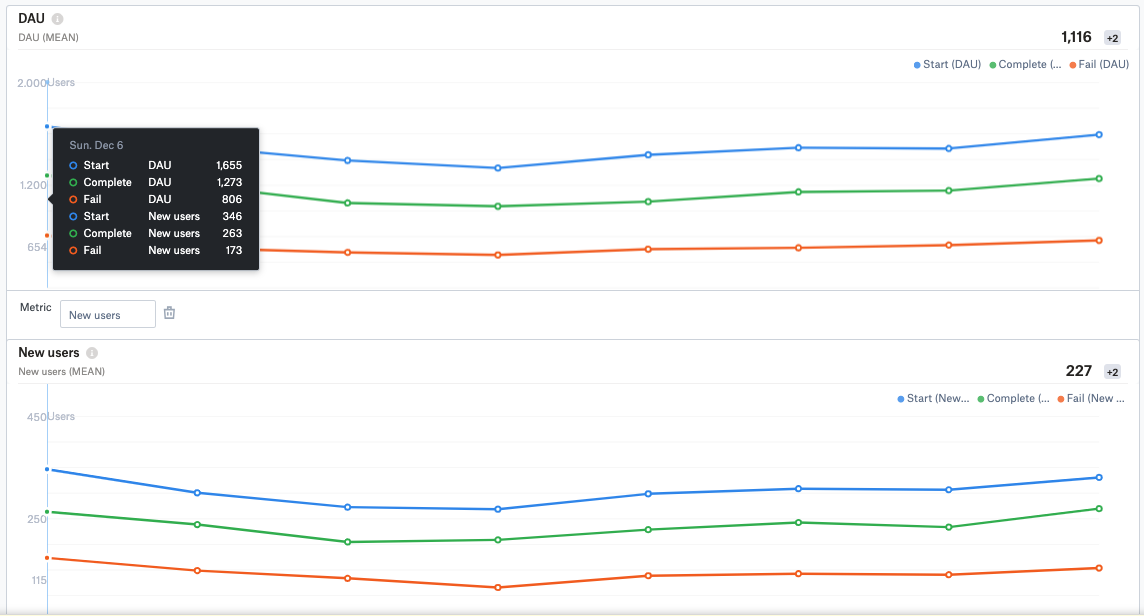
Comparison mode enables you to add a second graph, and select any metric you want to plot on it. All filters applied will then influence both graphs, so you can keep your tracking consistent without doing everything twice!