Overview
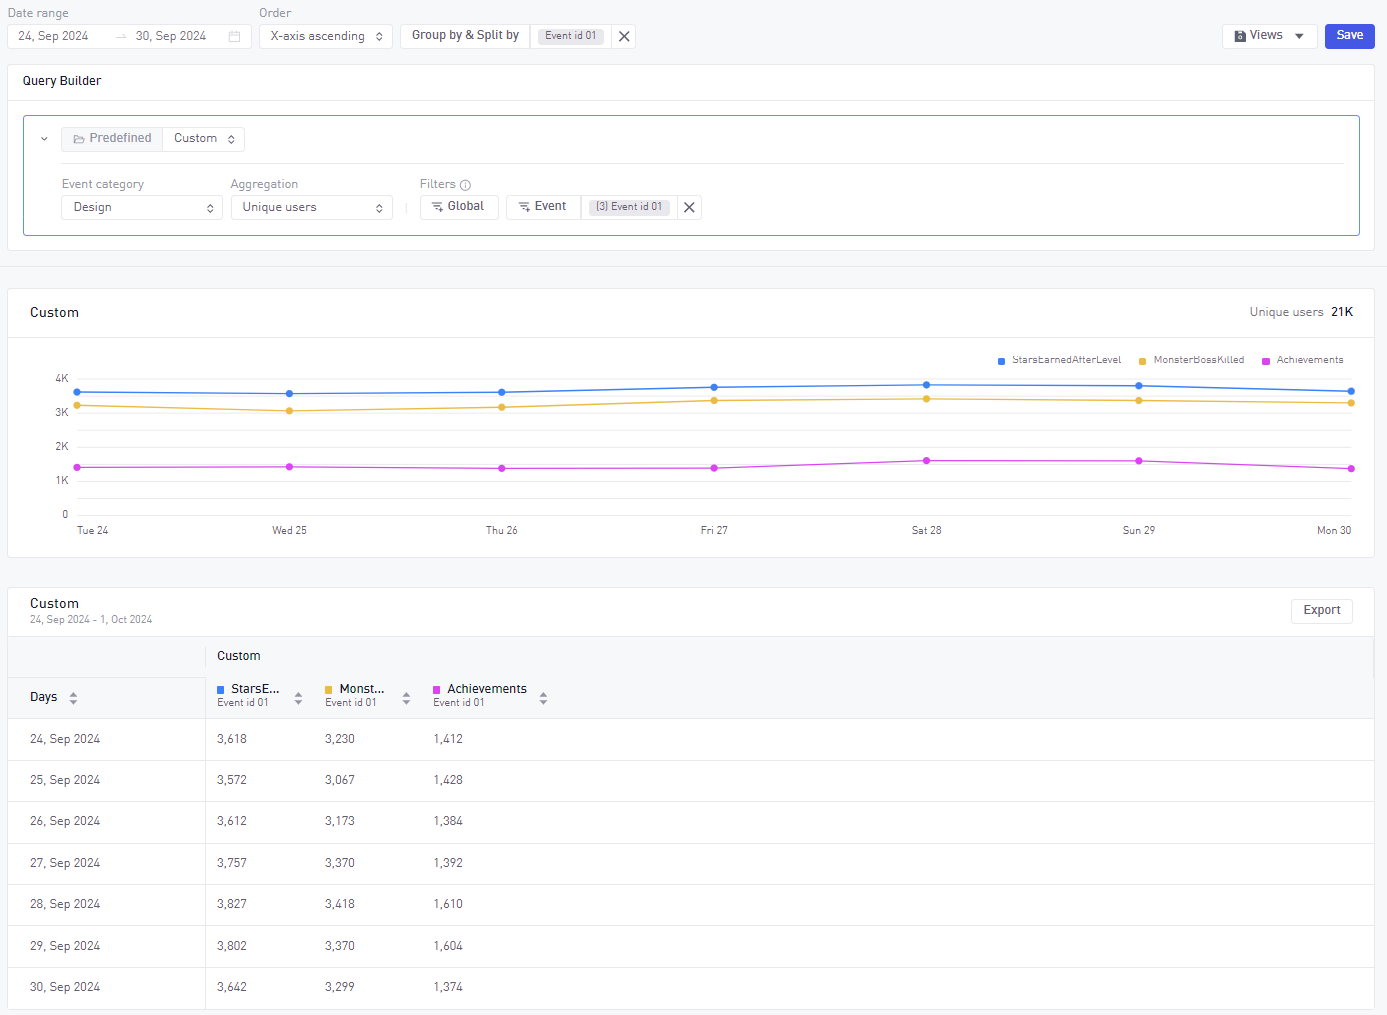
The Explore Tool is the place to dig deeper into the data to better understand the performance of your game. Here you can visualize a multitude of prepared metrics and freely create your own via a host of filters, aggregations and granularity options
Whether you would like to see data about users, revenue, errors or ad behavior, the Explore Tool can help you achieve your goals.
Summary
- Select from a list of predefined metrics for a quick analysis into important insights.
- Define your own metrics by selecting different event types and applying different aggregations.
- Apply Global or Event filters to the visualization
- Use Split and Group By to further segment the visualizations and get more exact insights
- Save your query as a view for easy access to custom metrics
- Export your data in a CSV to easily import it in spreadsheets or other software
