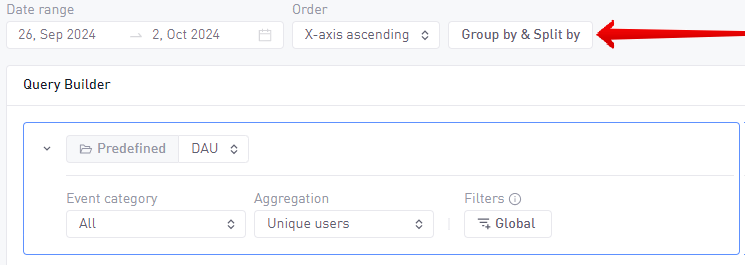
Group by and Split
Use Group by & split to segment your data even more.
Group by changes the buckets that data is aggregated to while Split by can separate data by a secondary dimension selected.
Group by
Group By is always active and the default selection is Time (Day) resulting in data being aggregated into buckets of UTC days. This is shown as a line chart over a period of time. Group by can be changed to the following:
| Grouping | Options |
|---|---|
| Time | Hour |
| Global dimensions | Specify a Global filter type |
| Event dimensions | Specify an Event filter type |
Event dimensions are only available if an event type with supported filters has been selected.
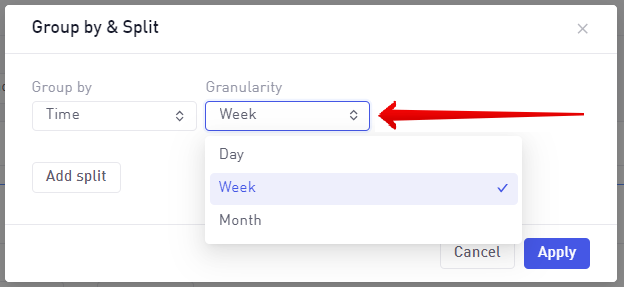
Group by time
Grouping by time allows different time granularities like Day, Week and Month. It also includes a granularity named All which will aggregate data into a single number.
This can be used to show the total sum of revenue over a period for example.
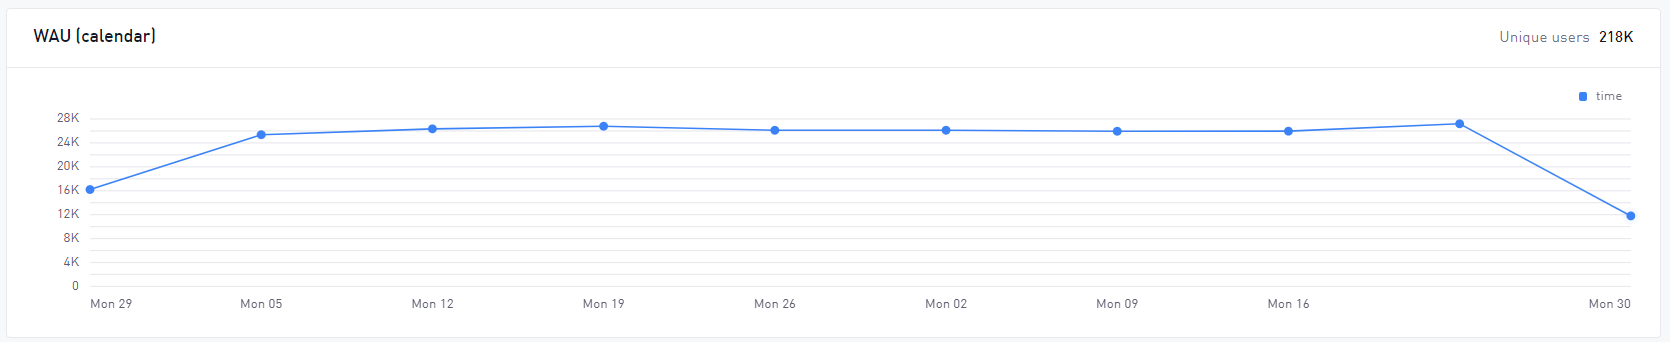
The example below shows how the data will look when grouping by Time > Week.
Once this is applied, the visualization changes to display the data with a weekly granularity
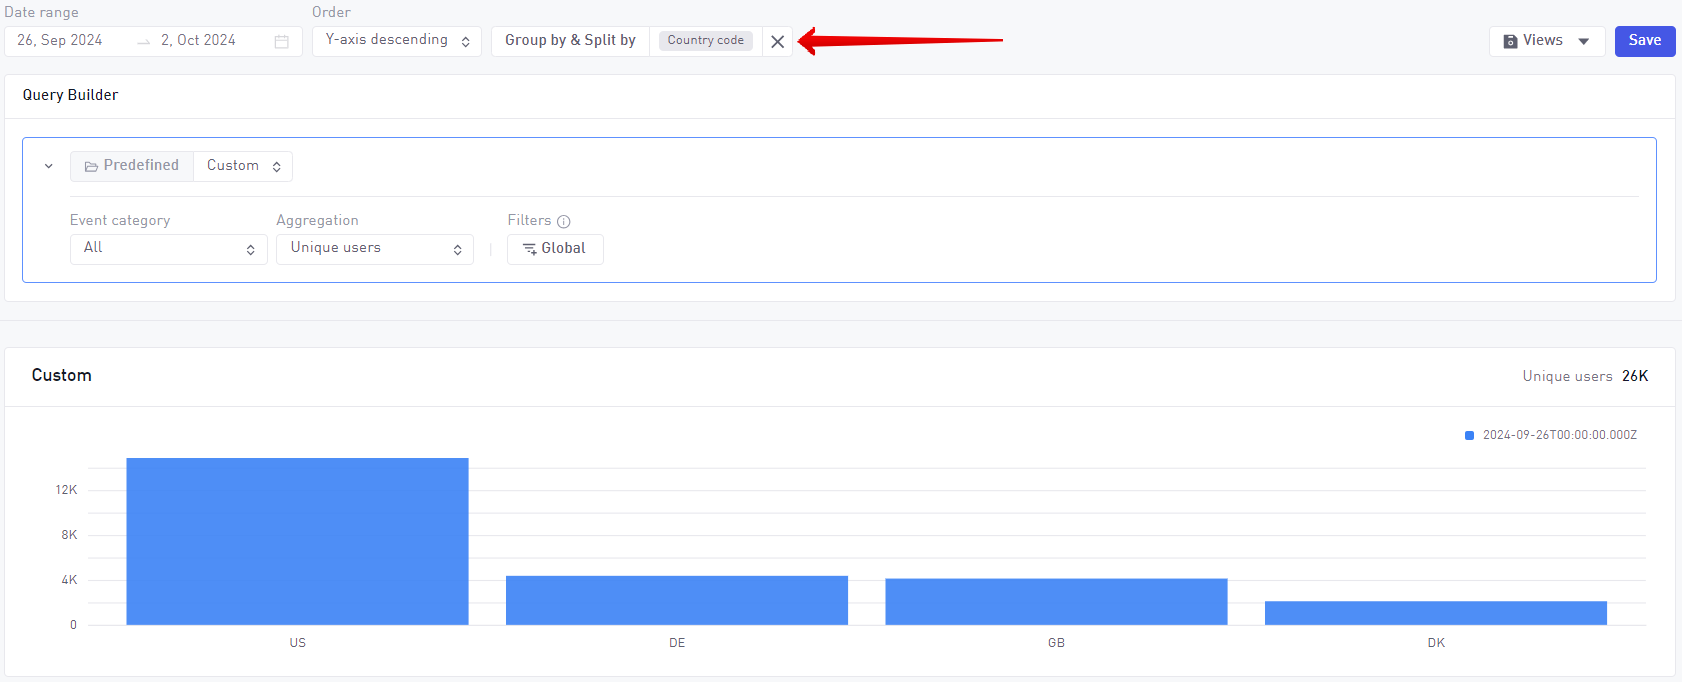
Group by global dimension
Grouping by a global dimension will aggregate data into buckets for each value found in the specified dimension type.
For example grouping by Country code will aggregate into each county code found in the data and display a barchart. If the selected aggregation is Unique Users then the reported number for each country would be unique users from that country over the period selected.
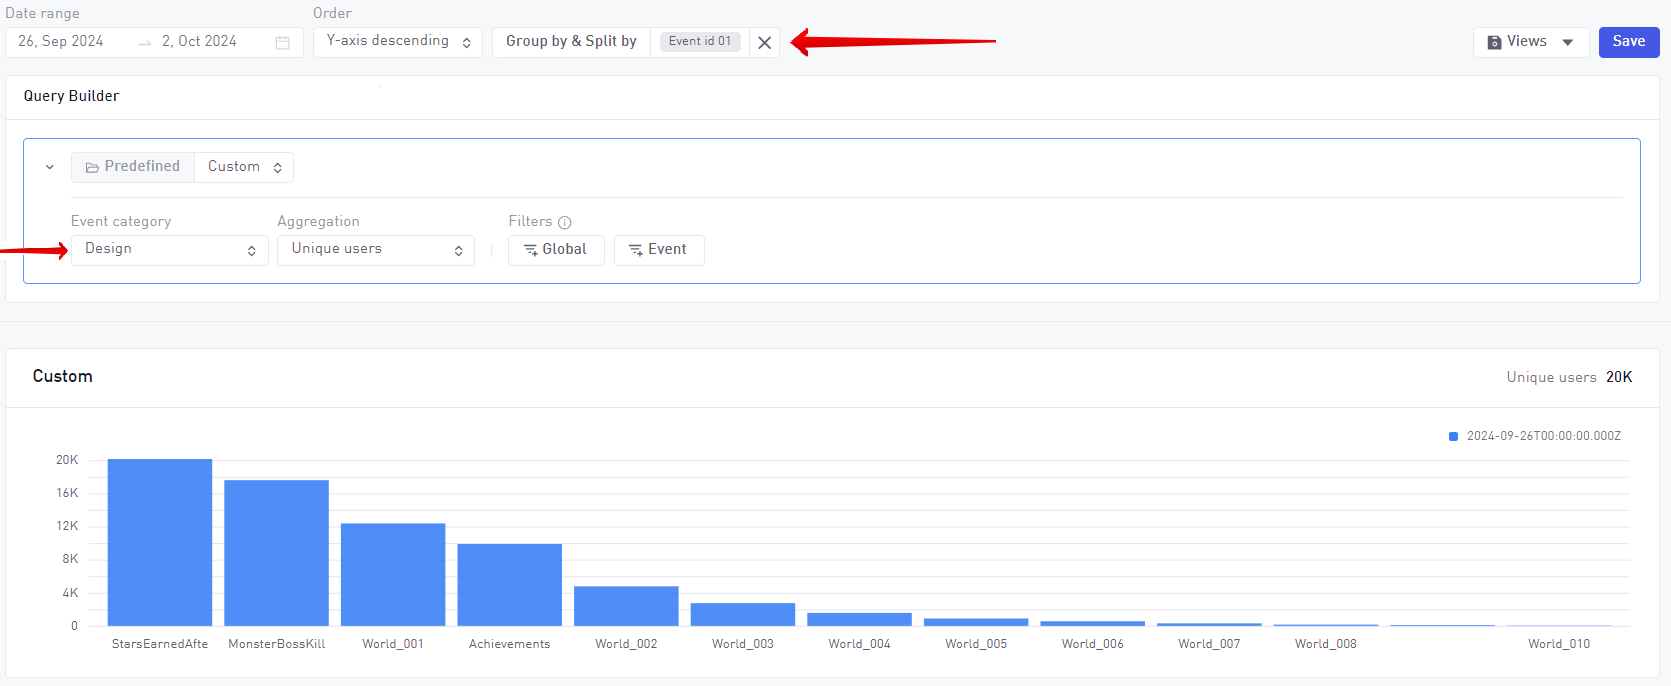
Group by event dimension
Grouping by Event Dimension works the same way as grouping by Global Dimension, but the segmentation will be done based on event filters.
For Event Dimensions grouping to be available, you must select the Event Category in the Query Builder to the event type that you want to group by, E.g: Grouping by Design Events ID1
Split by
Split by is an optional setting to separate the data aggregation defined by a Group by into a defined secondary (different) dimension.
Only Global dimensions or Event dimensions are possible to split by.
- Splitting data grouped by time will result in multiple line charts
- Splitting data grouped by a dimension will result in a stacked barchart
Below is an example of a query with a Split by Country Code (Grouped by Time):
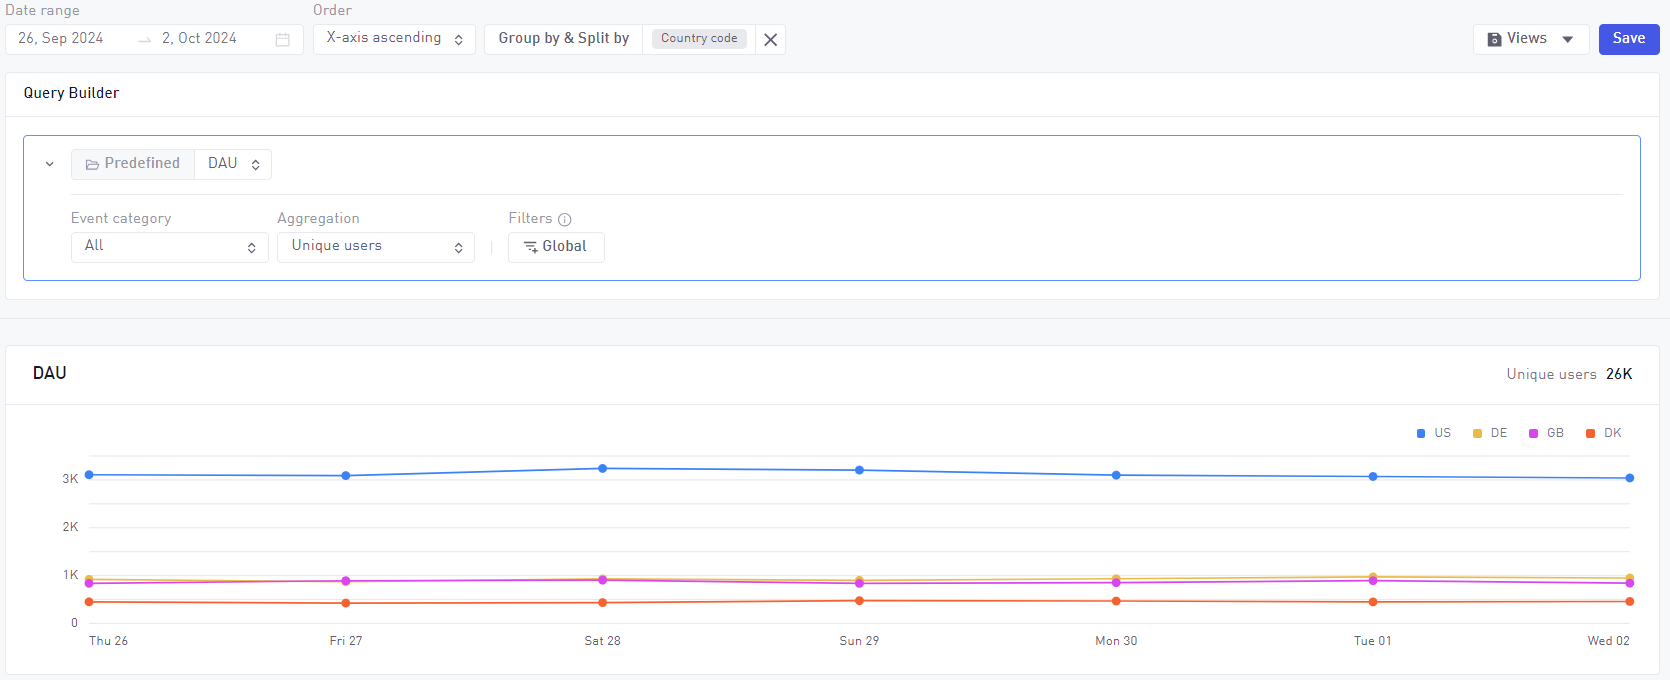
Group by and Split by is often combined with filtering to show only values needed. For example combining a filter for Country code equal to [UK/US] with a Group by equal to Country Code will show a bar chart for only those 2 countries.
Limit
The Limit option controls the maximum amount of unique string values returned from the data processing. If a specific dimension has more unique values in the data compared to the limit, then the top values are selected and some will be excluded.
The available options for the limit amount depends on whether a Split by is active.
| Action | Limit |
|---|---|
| Group by only | Can support up to 1000 unique values returned |
| Split only | Supports up to 1000 unique values returned |
| Group by and split | Supports up to 50 unique values returned |