Tabs
The Tabs feature allows for an easy way to compute different metrics and compare between them. At the moment you can add two extra tabs with metrics.
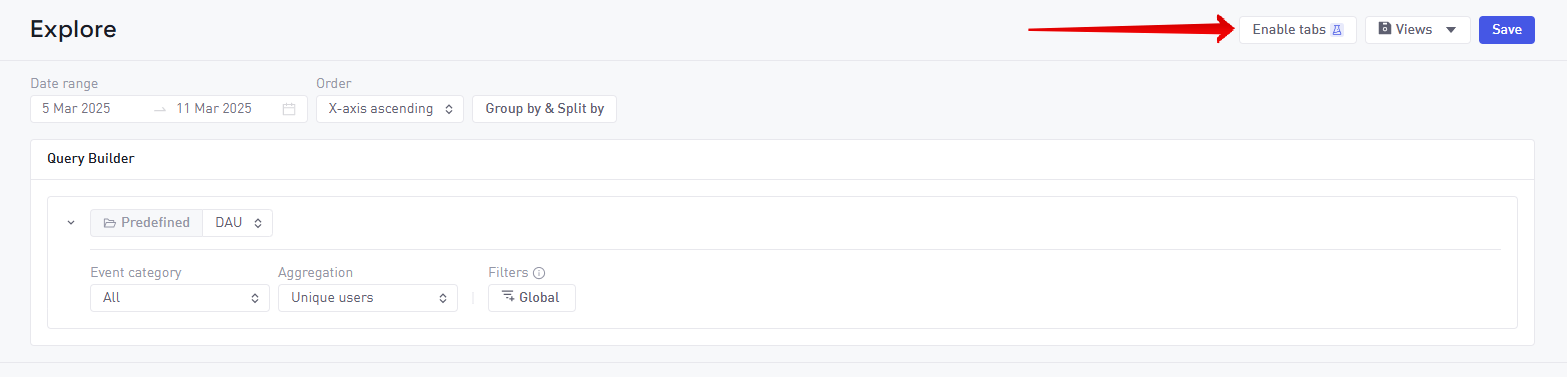
To enable the Tabs feature use the button highlighted in the image below:
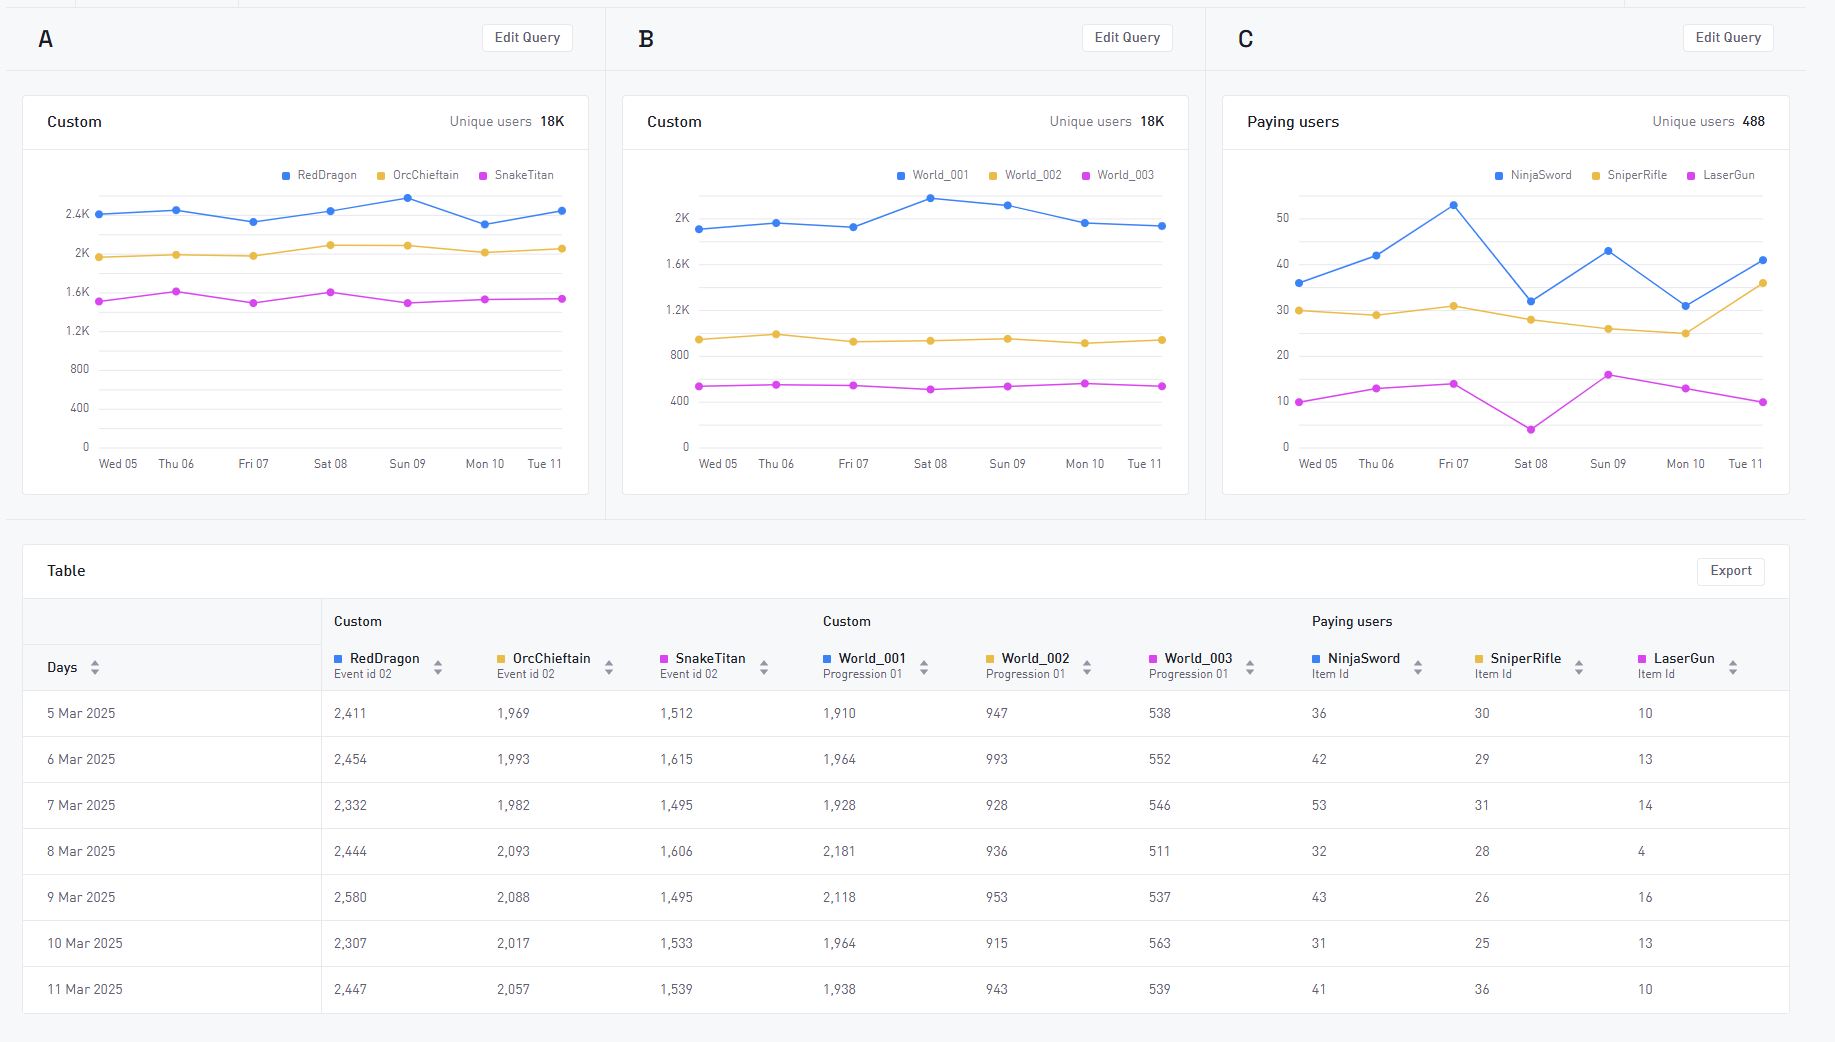
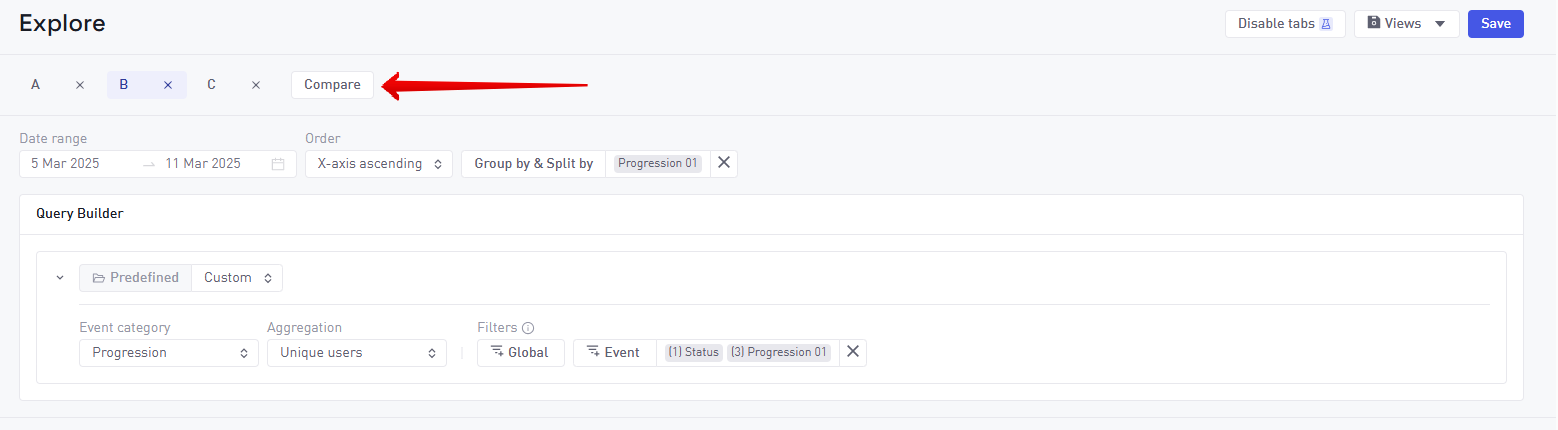
In the example below we've created 3 distinct queries, one examining Design Events, the other examining Progression Events, and finally the last one examining Business Events and in-app purchases. To compare the 3 different widgets, select the button highlighted in the image below:
Once that is done, you will be presented with a visualization of the 3 different widgets to compare, complete with a table that can be exported to a CSV format: