Monetization charts
Use the menu at the top of the page to edit how the visualizations look:
- Change date range of visualizations
- Filter by country code
- Add a secondary game to compare

To change the default date period, past 90 days, use the menu at the top of the page, specifically the Date range options:
- Yesterday
- Past 30 days
- Past 60 days
- Past 90 days
Change what countries are included in the visualization by using the Country code filter.
Only countries from users that have played the game/app are available in the list
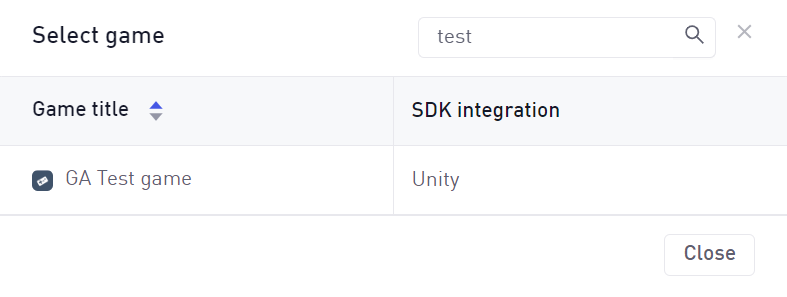
Compare games/apps
It's possible to compare IAP between the selected and a secondary game/app within the same organization. This will visualize data from both games to all charts, allowing for a comparison between the two.
Select the menu option called Compare to select what game you’d like to compare to.
Once selected, the visualizations will include data from both games/apps.

If no Business Events are integrated in the selected game, the Monetization feature will not show any revenue data.

Revenue calculator
The calculator on the page allows you to see the potential savings by transiting a percentage of your sales (Capture rate), to web shops, and paying for that volume, the lower web shop fee + fee of payment merchant, which is substantially less than the 30% - mobile platform fees. By changing the Revenue and Capture rate sliders, you can see the savings based on various scenarios
