View Results

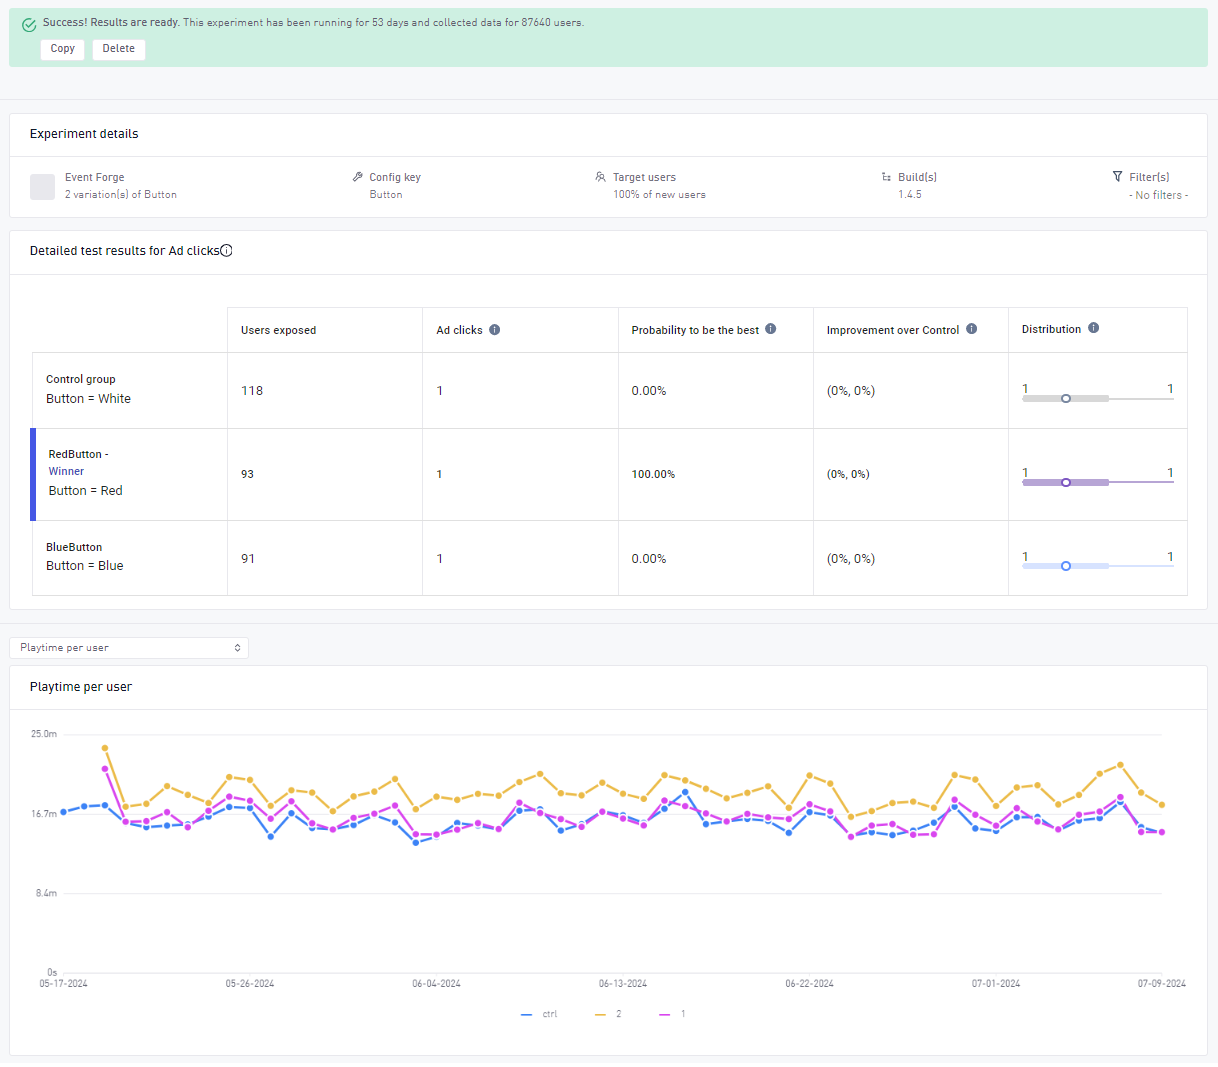
The Results page will display the outcome of the experiment. At the top of the page you will be able to see the Experiment’s configuration details along with its current status.

Right below you will find the Model table, with results of the model once it has successfully run.

In the model table, the metric is taken for the duration of the experiment. For example, conversion considers if any acquired player that was acquired in the experiment, converted during the duration of the experiment at all. The model only runs once enough players have been acquired in the experiment and a minimum amount of time has passed, and the information from the table corresponds to this. Data in this table will be static once the model has run.

A/B Test Results

Below the model table you will be able to see the core metrics table:

A/B Test Results

The core metrics table with all the metrics is always present and it gets updated every day with the latest daily data, even after the model has been run.

This tables contains some of our core KPIs and you will be able to see a comparison between the variants and how each variant performed compared to the control group. The values you see are daily averages from each day the experiment has been running. There is a colour indication to show you which values improved (green) and which became worse (red).

The current KPIs displayed are:

  • Revenue
  • ARPDAU
  • ARPPU
  • Conversion
  • Playtime per session
  • Playtime per user
  • Ad views
  • Session count
  • Retention