Filtering Outliers (Advanced)
Some goal metrics are susceptible to outliers. We frequently observe them within session (playtime per user, session count, etc.), and revenue related (ARPDAU, ARPPU, etc.) metrics. Leaving outliers in a data set can lead to bad conclusions during inference: we may falsely infer that some variants performed better than the others merely because of the presence of outliers. For example, a test device in a playtime data set can easily push a variant above a significance limit. This would result in an A/B test with the false conclusion that there is a winner variant.
To find outliers among a set of measurements one has to characterize the nominal data first. This is the part of the data where the vast majority of players contribute to. Outliers are isolated data points away from the nominal data. For example, a typical playtime per session data set looks like the following:
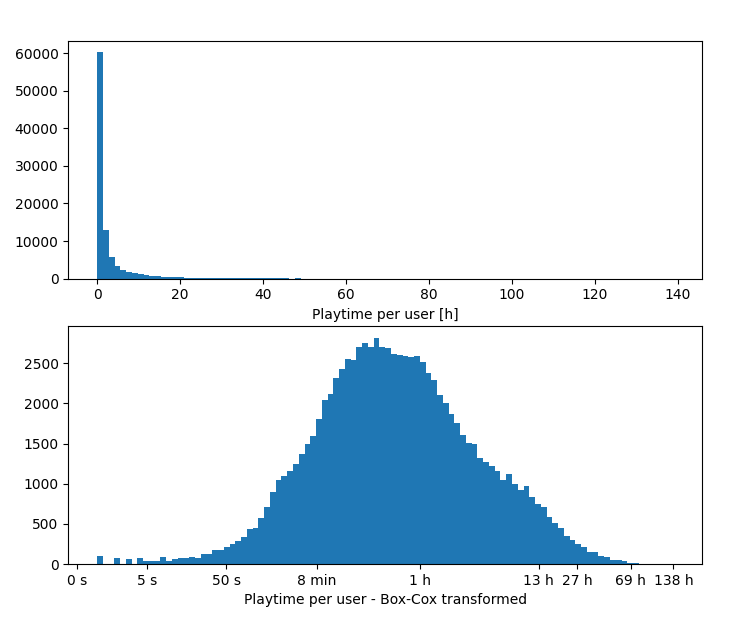
Playtime per user measurements of a 2 week long experiment. On the top image, you can see a histogram of the raw values. On the bottom image, you can see a normalized histogram.
The definition of outliers always depends on the domain, but based on the histogram above, we may argue that nominal data resides between 5 seconds and 70 hours in this particular experiment. Any isolated measurements greater than ≈ 70 hours can be considered outliers for this data set.
When we use Bayesian hypothesis testing, the first step is to come up with a model that may generate the measured results. Thus, to detect outliers in a Bayesian way, one must incorporate outliers in the generative model itself: we usually assume that the measurements are a probabilistic mixture of nominal data and outliers.
There are also non-bayesian techniques for outlier detection for the cases when Bayesian analysis is impractical. In these cases, Isolation Forests, Z-scores, robust – median deviation based – Z-scores, or other techniques are quite effective, especially after data normalization.