Use Cases
Let’s dive straight into some use cases for our A/B testing feature. How can you harness this tool to compare the Key Performance Indicators (KPI) between variants within your game? What are some real examples you could apply?
The following use cases will be covered:
- Use Case 1: Changing the starting in-game (resource) currency in a RPG game
- Use Case 2: Changing the speed of the ball in an arcade game
- Use Case 3: Changing the initial puzzle levels in a puzzle game
- Use Case 4: Changing the card animation in a casino game
Glossary
Here is a glossary of terms that are mentioned in the use cases.
| Term | Definition |
|---|---|
| KPI | Key Performance Indicator. A way to measure performance and evaluate the success of your game. |
| IAP | In-App-Purchases. Players may perform In-App-Purchases with real money to buy something within the game (e.g. a character skin). |
| Retention Day X | The percentage of users that came back to play the game X days after installing. |
Use Case 1: Changing the starting in-game (resource) currency in a RPG game
‘What happens when I change the number of coins a player starts with in my RPG game? How does it affect Day 7 retention?’
Let’s assume you have an RPG game and you want to test different scenarios where your players start with a different amount of coins. How would that affect their behaviour? Would an increase in coins improve the core KPIs? Would it reduce D7 Retention? These questions can be answered by using A/B testing.
In this use case we’ll have the control group, which is the default value (600 coins) and 2 variants: Coins800 (800 coins) & Coins1200(1200 coins). After you run the test, you’ll get results as shown below where you can draw various conclusions:
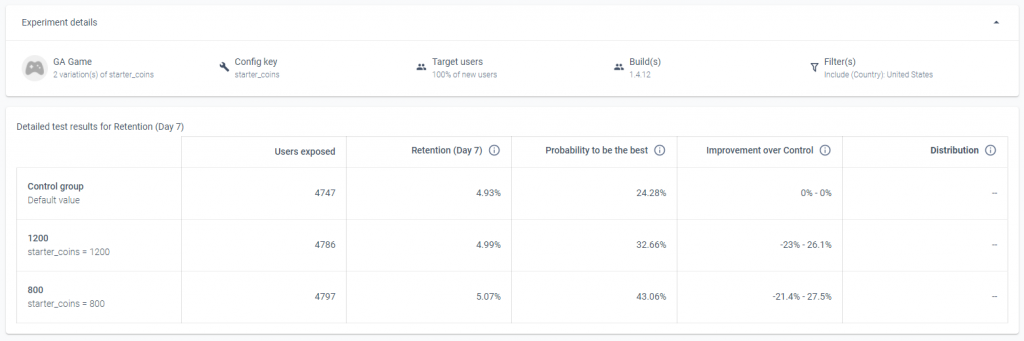

In this example, we can see that increasing the coins also increases Day 7 retention for both variants (800 & 1200). Both of these variants have a higher probability of being the best over the default starter coins (600). The playtime looks fairly similar between all variants, so it’s difficult to draw a conclusion there. What’s really interesting is that 800 actually has a higher Day 7 retention than 1200, even though the players started with less coins. This also means that the variant of 800 coins has a higher probability to be the best over the 1200 coin variant. We’ll check the other core KPIs below:
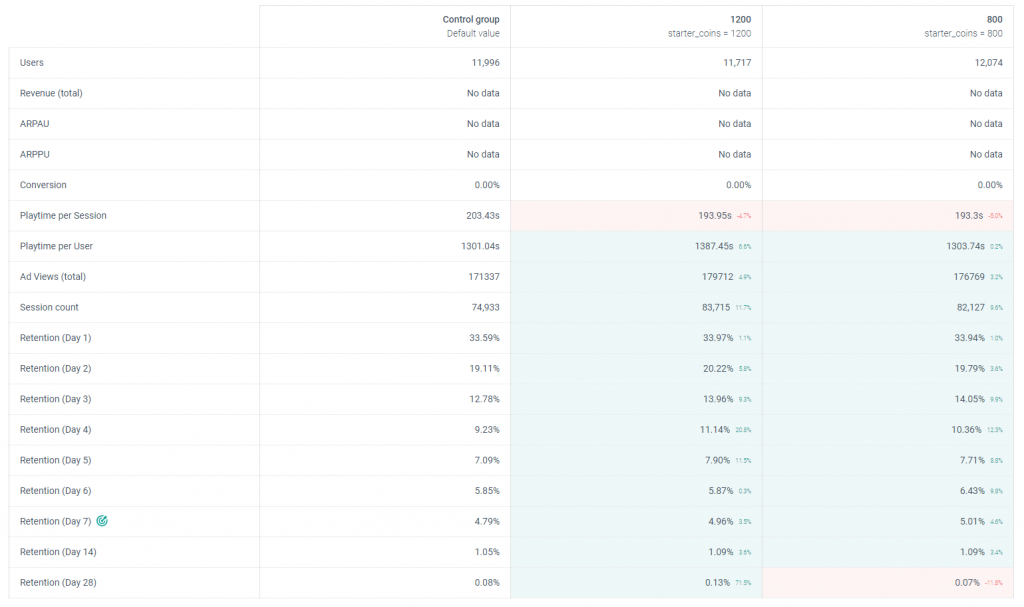
Similar to the table above, we notice that both variants with higher coins have better KPIs overall, so they have a higher chance of being the best. We also notice that from Day 1 to Day 6 retention, 1200 coins has very slightly higher numbers, however for Day 7 retention (which is the Goal Metric), the 800 coin variant is higher slightly. We can perhaps explain this because when players start with 1200 coins, they would most likely scale a lot quicker (in game) compared to when they start with less coins, and perhaps lose interest quicker as well as a result.
How you determine a winner depends on a lot of factors, including the Goal Metric. In this example, if you valued less (or more) than Day 7 retention, perhaps the 1200 coin variant would be the winner.
Please read the Conclusions section below…
Use Case 2: Changing the speed of the ball in an arcade game
‘What if I increase the speed of the ball? Would that improve our Day 1 retention?’
In this scenario, let’s assume we have an Arcade game where the player has to dodge obstacles with a ball. What happens if we increase the speed of the ball? Would that also improve our core KPIs by making the game more challenging and interesting?
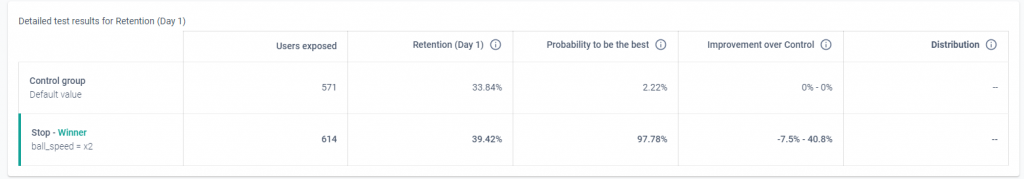

The playtime graph shows that the player group that had a higher speed (*2) generally have a higher playtime. It’s important to note that the Goal Metric here was Retention Day 1. In the table above, we can see that the retention is significantly higher when the ball speed was also higher. As a result we can safely & comfortably say that the winner is the variant with the higher ball speed as the probability to be the best is estimated at 97.78%.
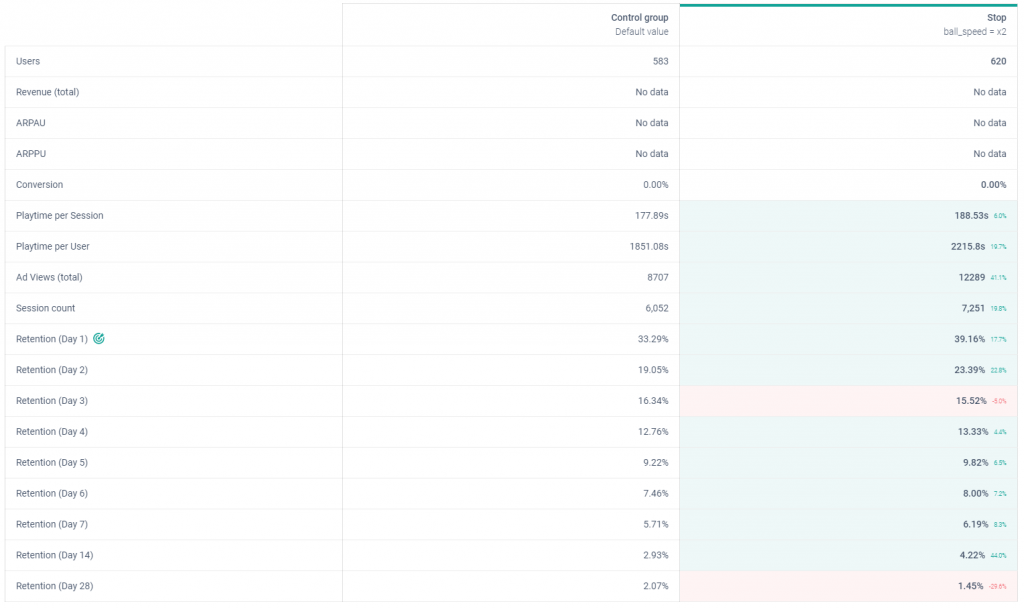
In general the core KPIs look better in the variant with the higher ball speed, so it’s not just the Goal Metric. There is a clear winner in this case.
Use Case 3: Changing the initial puzzle levels in a puzzle game
‘Which starter level sequence is more likely to retain more players?’
Let’s assume we have a puzzle game and in the game there is a default level starter sequence, but we want to try out 3 new ones. Which one is more likely to retain the most players? How can we compare these? Our Goal Metric will be Retention Day 1. Let’s implement an example like this and have a look at the results:
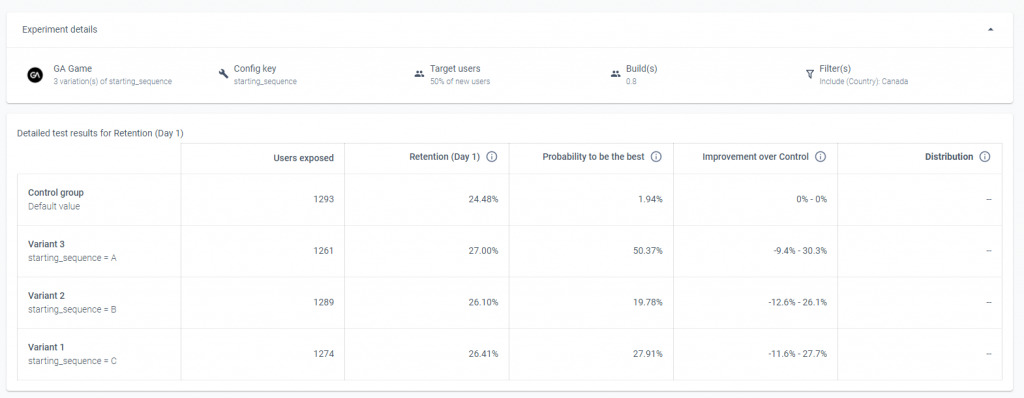

From the table we can see roughly an equal amount of players exposed between each variant, however one variant does stand out when it comes to the Goal Metric and that is Sequence A, where the probability to be the best is significantly higher than the rest of the variants because D1 retention is also higher. Let’s take a look at the rest of the core metrics:
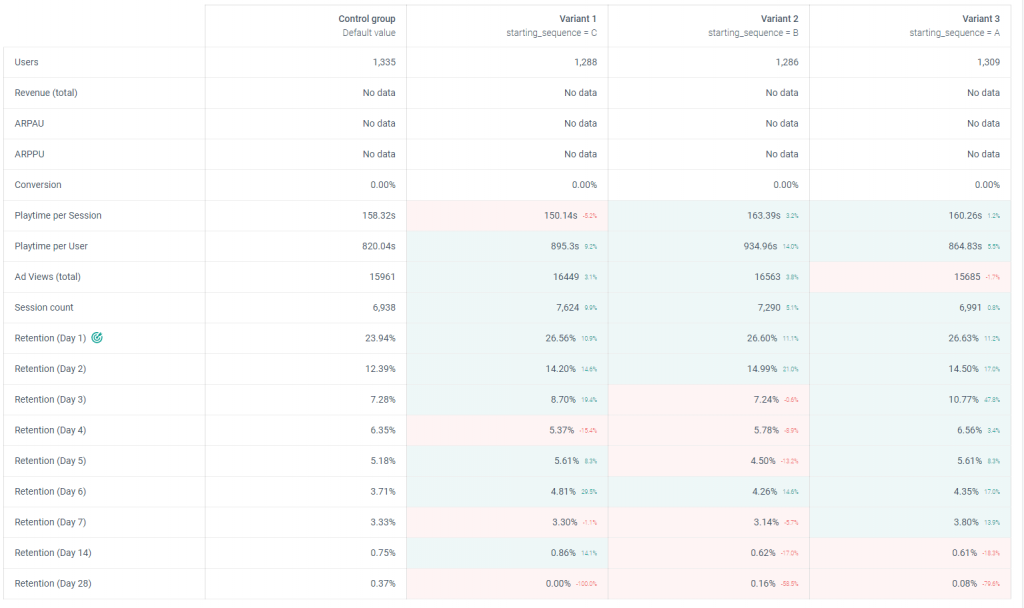
In general the numbers do look better compared to the default sequence, so we can safely assume that we would want to change the starting sequence of our game. The Retention numbers look especially better for Starting Sequence A, so we can use this information and the Goal Metric winner probability to conclude that this starting sequence is potentially the best out of all of them.
Use Case 4: Changing the card animation in a casino game
‘Which card handout animation is more likely to improve our key metrics?’
Let’s assume we have a casino game, where cards are handed out to players. In this use case we want to test out a new card handout animation compared to the current default one. How does it affect our key metrics? Let’s implement an example and have a look at the results:
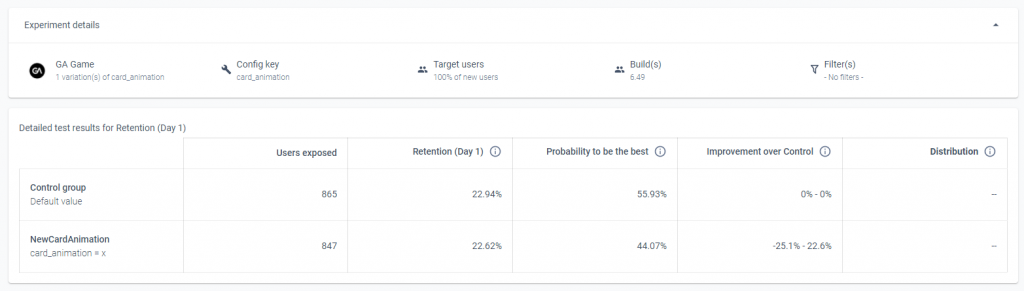
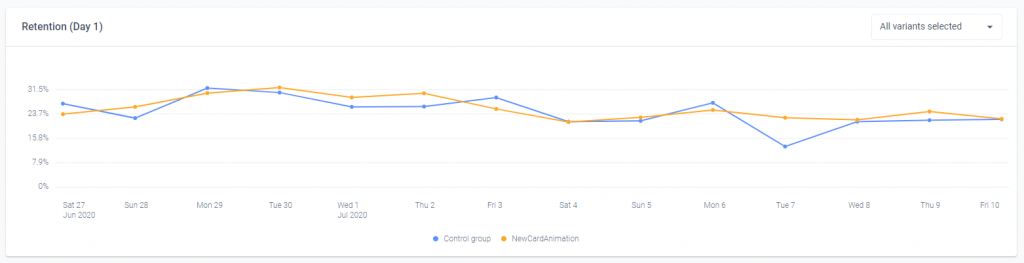
According to the A/B test result above, there doesn’t seem to be a clear winner when it comes to playtime or the Goal Metric (Retention Day 1). Let’s take a look at the core metrics:

Again, above we can see that the numbers are very slightly worse for the new card animation variant, but there isn’t a significant difference between both variants. In this example, it is very difficult to tell which is the winner. The numbers are slightly worse for the new animation, but is it enough to declare the default one a winner? Perhaps the card animation is a non-factor and players simply don’t care enough about it to make them want to come back.
Conclusions
A really important thing to note is that you shouldn’t necessarily derive conclusions from the results. They can be misleading. Results will just show you an indicative but it’s also essential to check the statistical analysis for the core metric to understand if the changes observed are meaningful or not.