Results
The table displays rows of cohort install intervals (days/weeks) and columns (days/weeks) for the specific cohort return intervals selected.
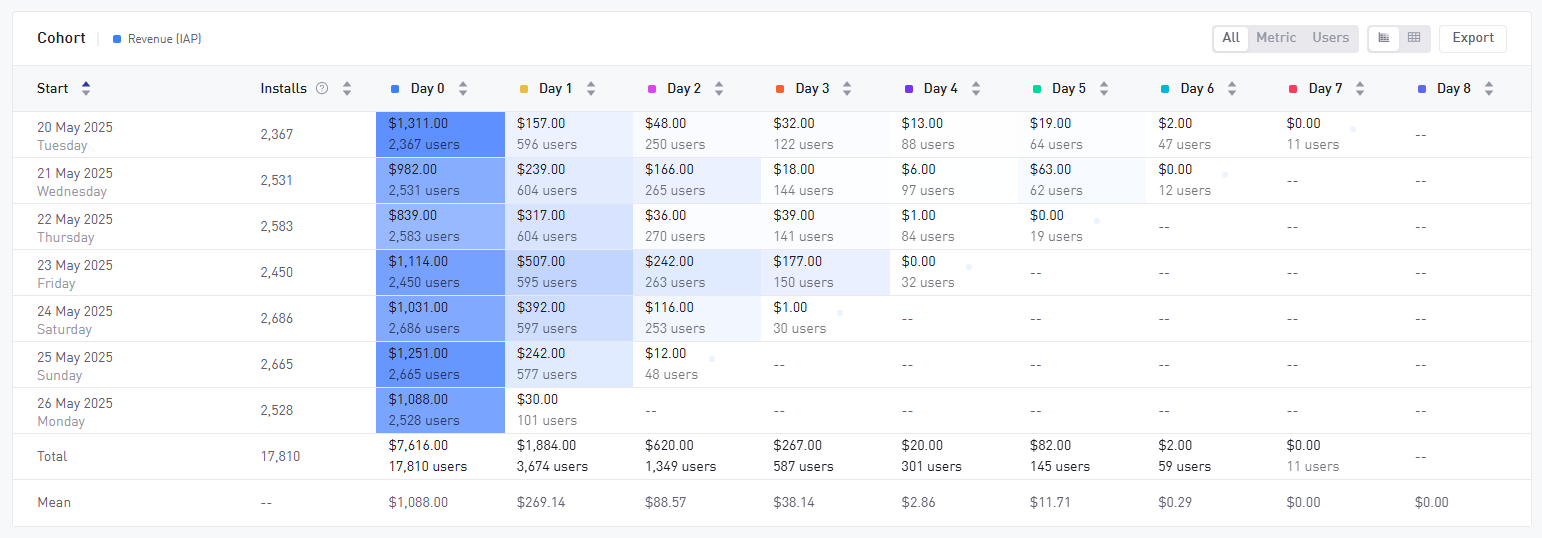
Most metrics report what the returning users did on the specific returning day/week only. Certain metrics (cumulative) report the sum since install time like Cumulative Revenue (IAP & ILRD).
The table can be configured in relation to what metric data is shown (metric, users or both), whether to show the heatmap coloring and exporting the data (showing the underlying data in raw format).

Interpreting cohort intervals
Based on install and return intervals, it's possible to look at a combination of days and weeks.
Days/Days

3,268 users installed on 19 May 2025. 356 of those users returned 2 days after (Day 2) and generated $109 of revenue.
Days/Weeks

3,268 users installed on 19 May 2025. 809 of those users returned during the following 7-day period after install (Week 1) and generated $548 of revenue during that period.
Weeks/Days

23,569 users installed during the week "19 May 2025 - 25 May 2025". 5677 of those users returned 1 day after they installed (Day 1) and generated $2541 of revenue on Day 1.
Weeks/Weeks

23,569 users installed during the week "19 May 2025 - 25 May 2025". 1647 of those users returned during the following 7 day period after install (Week 1) and generated $1930 of revenue during that period.
Realtime reporting
The Cohorts feature can report on the current on-going day/week (UTC) in realtime. Data points that are based on incomplete intervals will show a blue pulsating dot.

Depending on whether Days or Weeks are selected when building the visualization, the table will either present an incomplete day or incomplete week.
Footer values
The table footer contains aggregated totals and means across all cohort install intervals.
The calculation of these values depend on the type of data reported by currently selected metric.
| Metric state | Footer values |
|---|---|
| Metric is a sum or count | Totals and mean values reported.  |
| Metric is a mean or ratio | Totals not displayed. Mean is calculated as a weighted mean (user counts as weights).  |