Realtime Dashboard
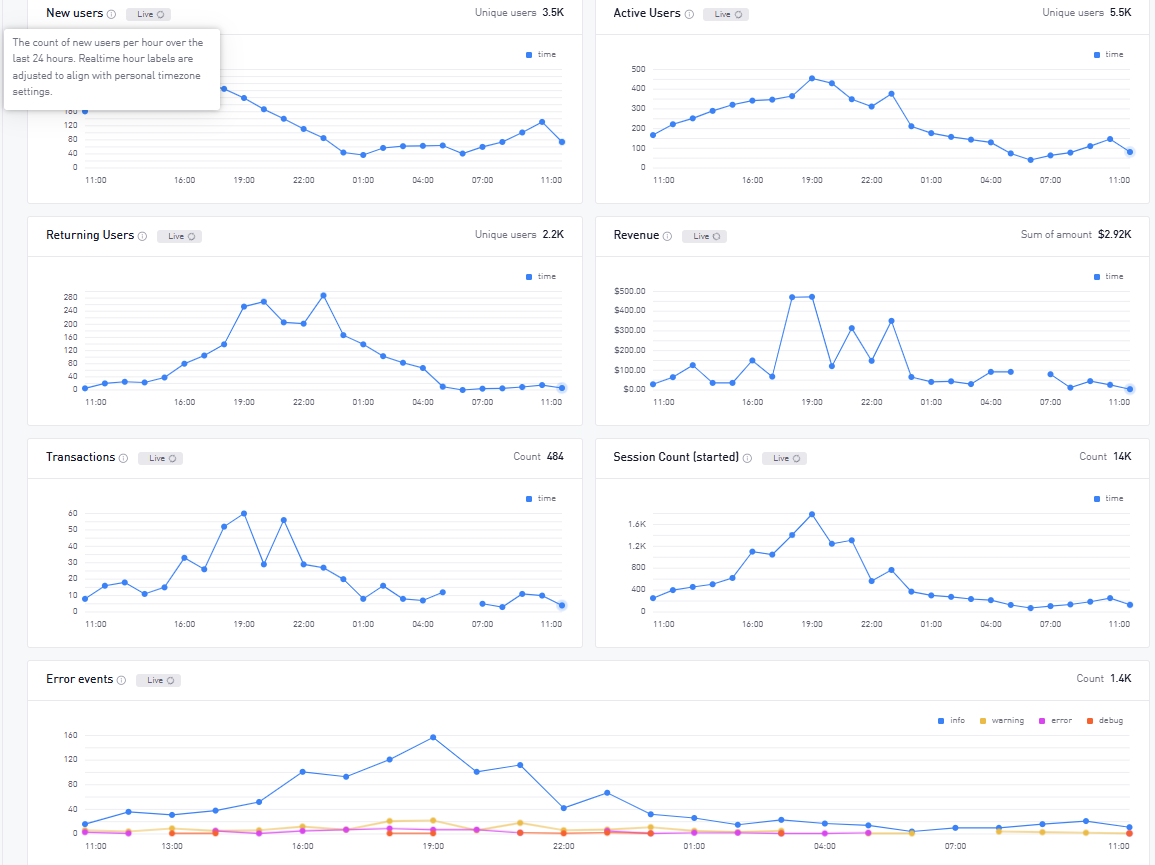
The Realtime Dashboard allows for browsing your data for the past 24 hours. Analyze New Users, Active Users, Returning Users and more.
Because the data on this Dashboard updates almost instantly after an event is registered it’s a good place to check once your app has been integrated, to see whether the integration has been successful.
- Keep track of metrics in realtime
- Check whether the SDK integration was successful
- Check whether your campaigns were successful by analyzing New Users
- Analyze most recent errors and crashes
- Analyze up to 50 last events in raw format, with the possibility of filtering by user ID
- See a list of integrated of SDKs that have been integrated in the app

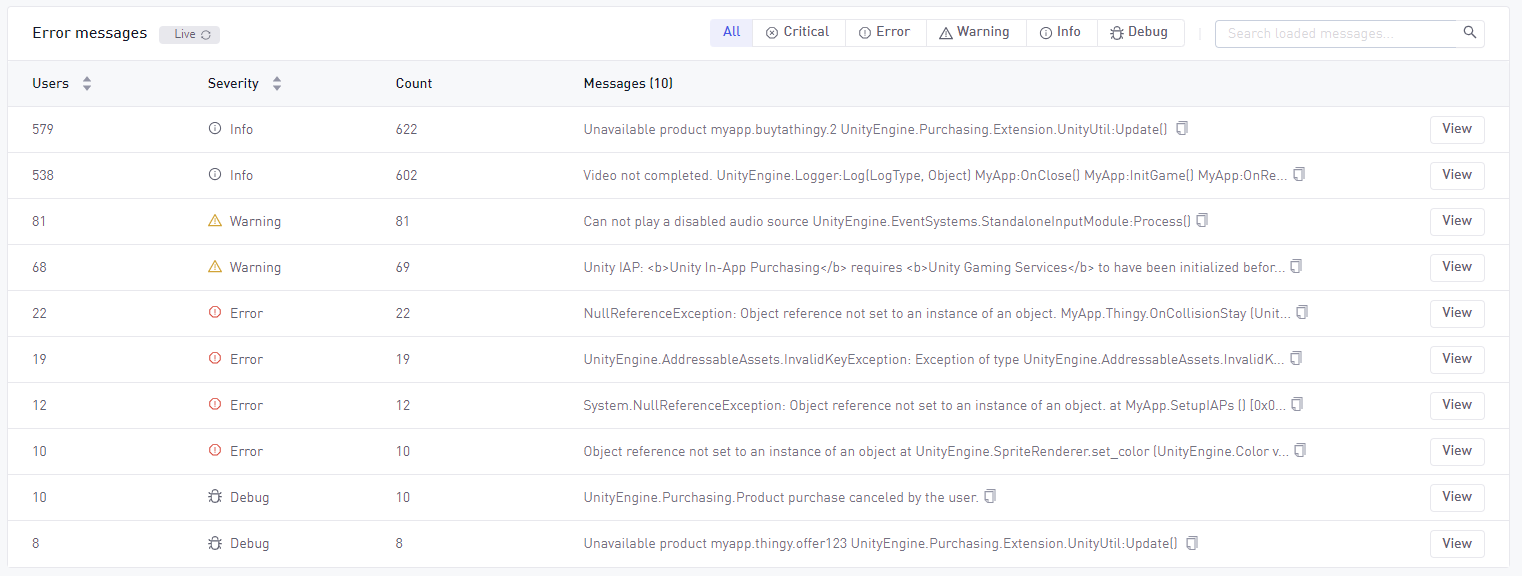
The Realtime dashboard also includes a table to check for any errors/crashes the app might have encountered.

It’s possible to view the most affected builds and average errors per user per build by selecting the View button
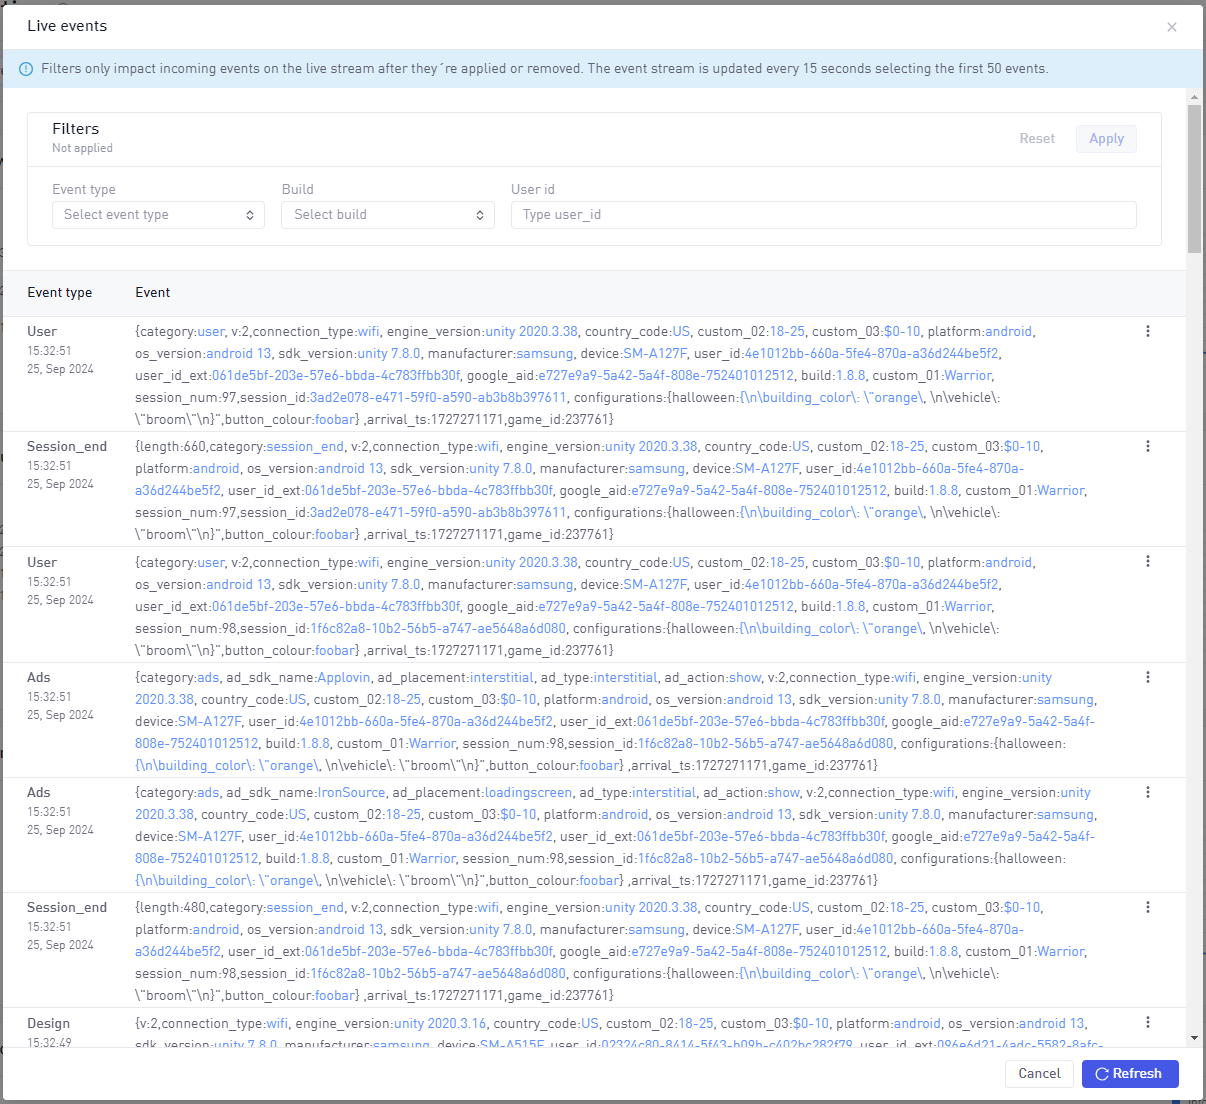
Live events
Live events can be used to browse through the last 50 sent events in raw format.
There’s also the possibility of filtering by Event Type, Build and User ID when analyzing the events.
This feature is extremely useful when starting to integrate different events, as you can see whether the event was registered or not, in a timely manner, usually taking around half a minute for the event to appear in the list after it has been sent.

SDK Status
It’s also possible to view the different integrated SDK versions and how many events they register, by selecting the button next to Live Events, titled SDK Status.