Analyzing the results
While analyzing the results, there are opportunities to either browse through the chart or table, or both.
Chart
The chart displays a timeline (days) matching the selected date-range and for each Days ahead a line chart will be visible.
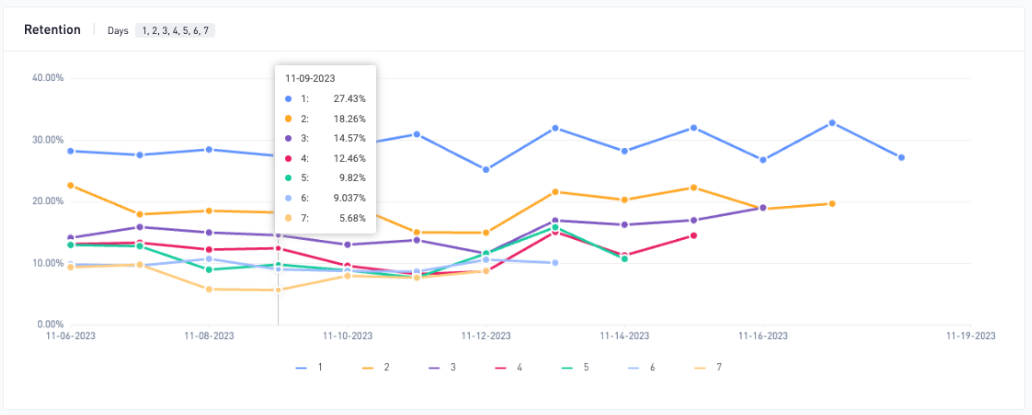
For each day on the line chart a ratio (percent) is displayed for the players starting some X days before (A) and returning on the day observed (B).
Day7 Retention Example
A = Count of players installing 7 days before the 30th of December.
B = count of players playing on the 30th December who also installed 7 days before.
30th December Retention = B / A * 100.
Adding Triggers, Global filters and Event actions further increase the complexity of the calculation.
Consider the following configuration example:
- Date range set to 30 days.
- Days ahead = 7.
- Start trigger set to Event type = Progression, and property = Stage - 10.
- Return Trigger set to default (Any session).
- Global Filter set to Country = US
- Event actions set to Event type = Session Start and Build = 1.0.0
Calculation of A
- Only consider events having Country = US
- Count of players who 7 days before the 30th December sent a Level-10 Progression Event AND also sent a Session Start event (with Build property = 1.0.0) during the 30 day period.
Calculation of B
- Same conditions as A, but with an added AND condition of players having played a session on the 30th December.
- 30th December User Return Rate = B / A * 100.
Retention is displayed on the chart title when the start condition is "install." User Return Rate is displayed when using a custom start trigger.
Table
The table displays the same data as the chart, but can also reveal the numbers (player count) behind the calculations.
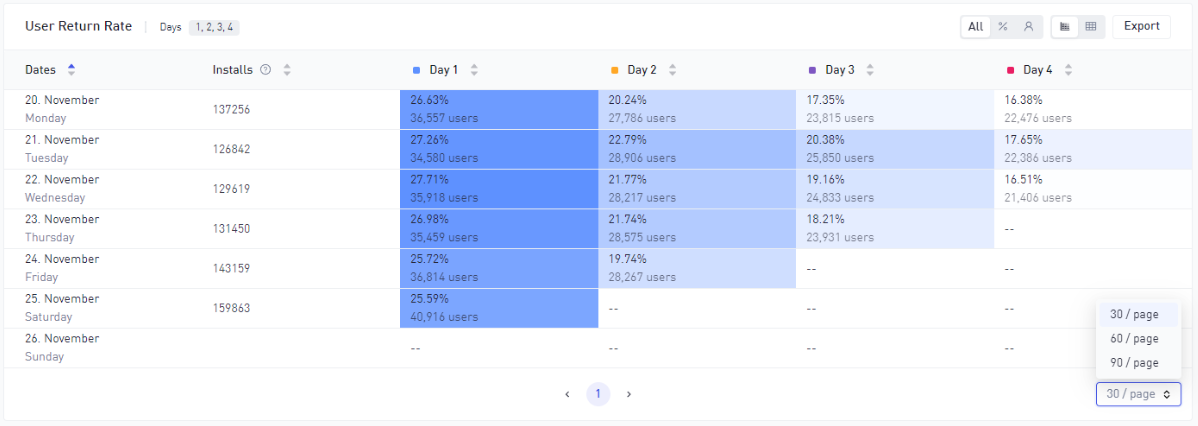
By default the table will present the information using both player count and percentages (All) and with a heatmap enabled. This can be altered using the controls in the top-right corner.

The table will display 30 days (rows) by default and this can be altered to show up to 90.
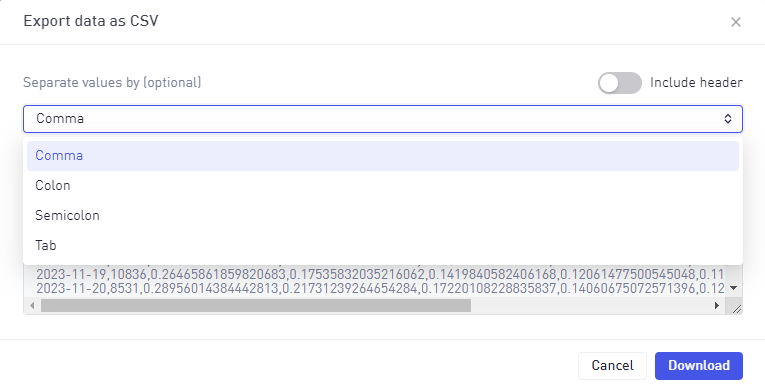
It is also possible to export the data from the table using the Export button and this will provide options to define the format of the data before exporting.