Results
Results for Funnels differ based on what type was created, but there are also points of data that are common between the two:
| Data point | Definition |
|---|---|
| Total conversion | Percentage of users that have completed the first have completed all the steps in the Funnel. |
| Total Churn | Percentage of users that have churned by the end of the Funnel. |
| Total Users | An estimate of the total users added to the Funnel. |
| Biggest drop | The step where the biggest churn of users happens. |
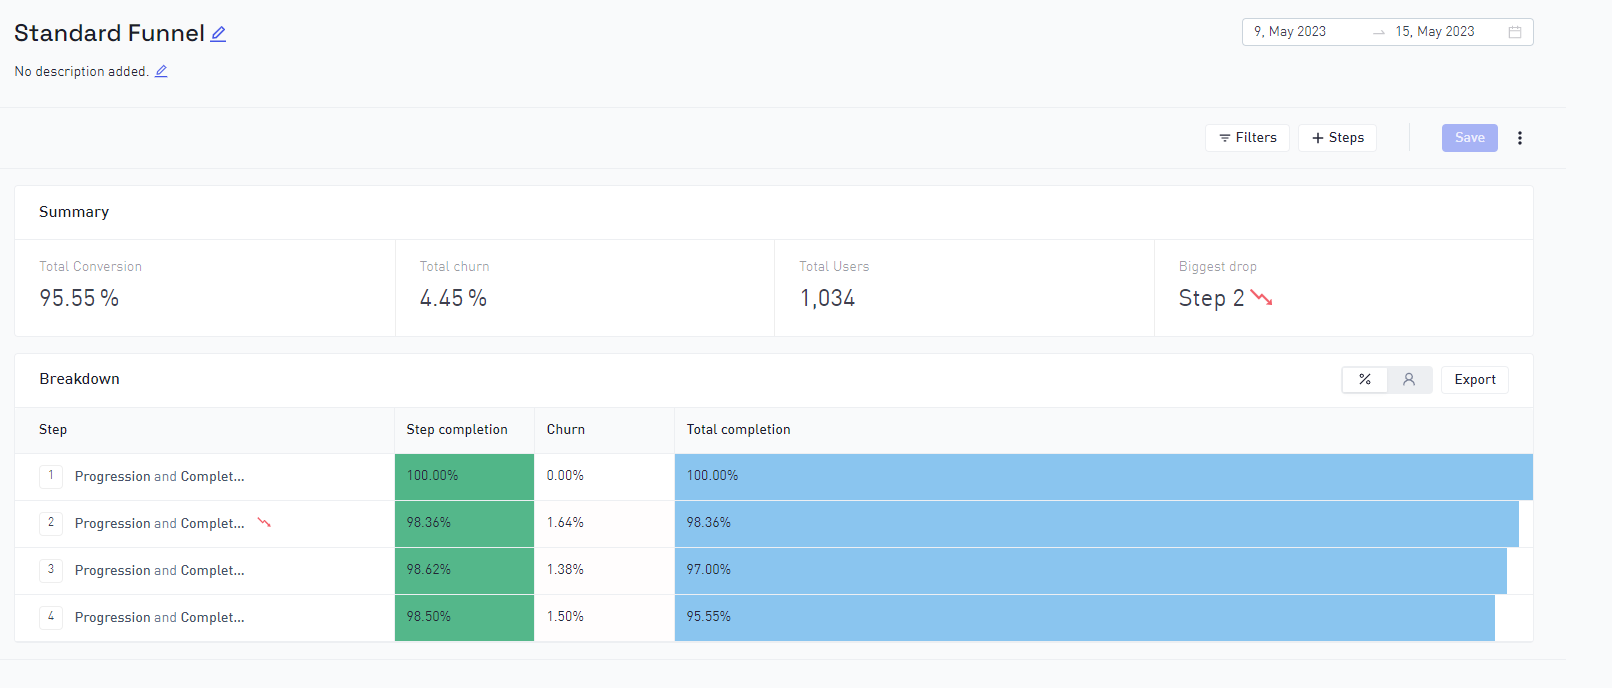
Standard Funnel results
| Data point | Definition |
|---|---|
| Step completion | Percentage/Number of users that have completed the previous and current step. |
| Churn | Percentage/Number of users that have completed the previous step, but have failed to complete the current step. |
| Total completion | Percentage/Number of users that have completed all the steps in the Funnel. |
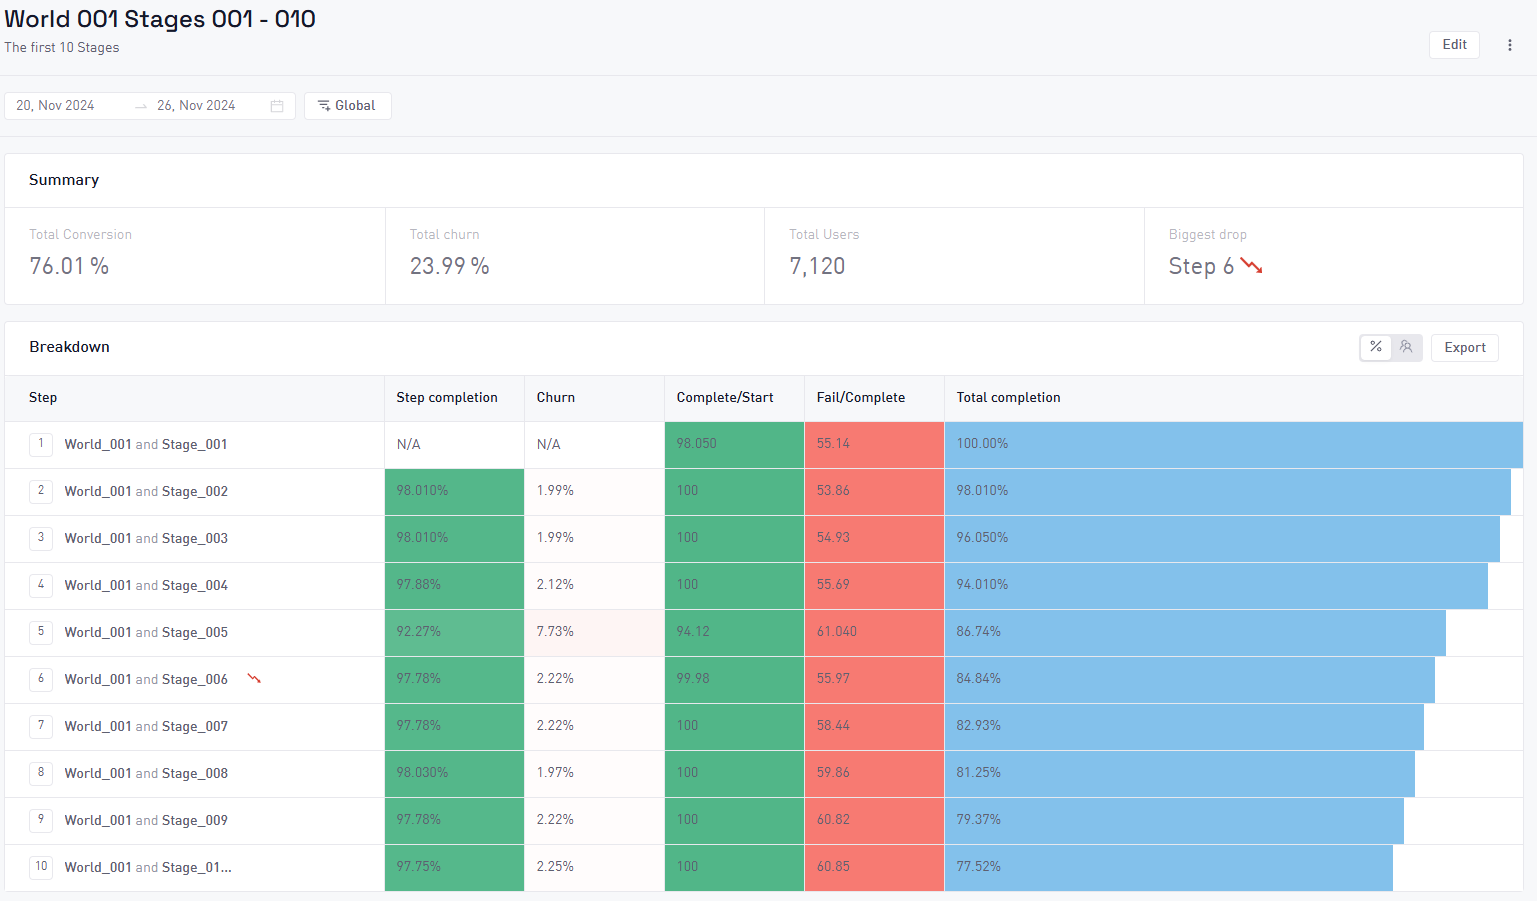
Progression Funnel results
| Data point | Definition |
|---|---|
| Step completion | Percentage/Number of users that have completed the previous and current step. |
| Churn | Percentage/Number of users that have completed the previous step, but have failed to complete the current step. |
| Complete/Start ratio | Percentage of users that have completed all previous steps and started the current step, and have also completed the current step. |
| Fail/Complete ratio | Number of users who have completed all previous steps and failed the current step divided by the number of users who have completed all previous as well as the current step |
| Total completion | Percentage/Number of users that have completed all the steps in the Funnel. |
Additional functions
The results page supports additional functions to customize and analyze the data:
- Change between results being displayed in integers or percentages
- Download the data in a CSV format to analyze in other products
