Dashboards
Dashboards give you a fast, visual overview of your key metrics. Choose from powerful predefined dashboards or build your own to track what matters most to your game.
Predefined Dashboards: Help you monitor core performance metrics without any setup required.
Custom Dashboards: Allow you to tailor your dashboards to match the unique mechanics and features of your game, for example visualizing Design (custom) events or mixing monetization and engagement metrics.
Predefined Dashboard Guide
GameAnalytics comes with a list of Predefined Dashboards to analyze important metrics:
| Dashboard | Overview | Metrics |
|---|---|---|
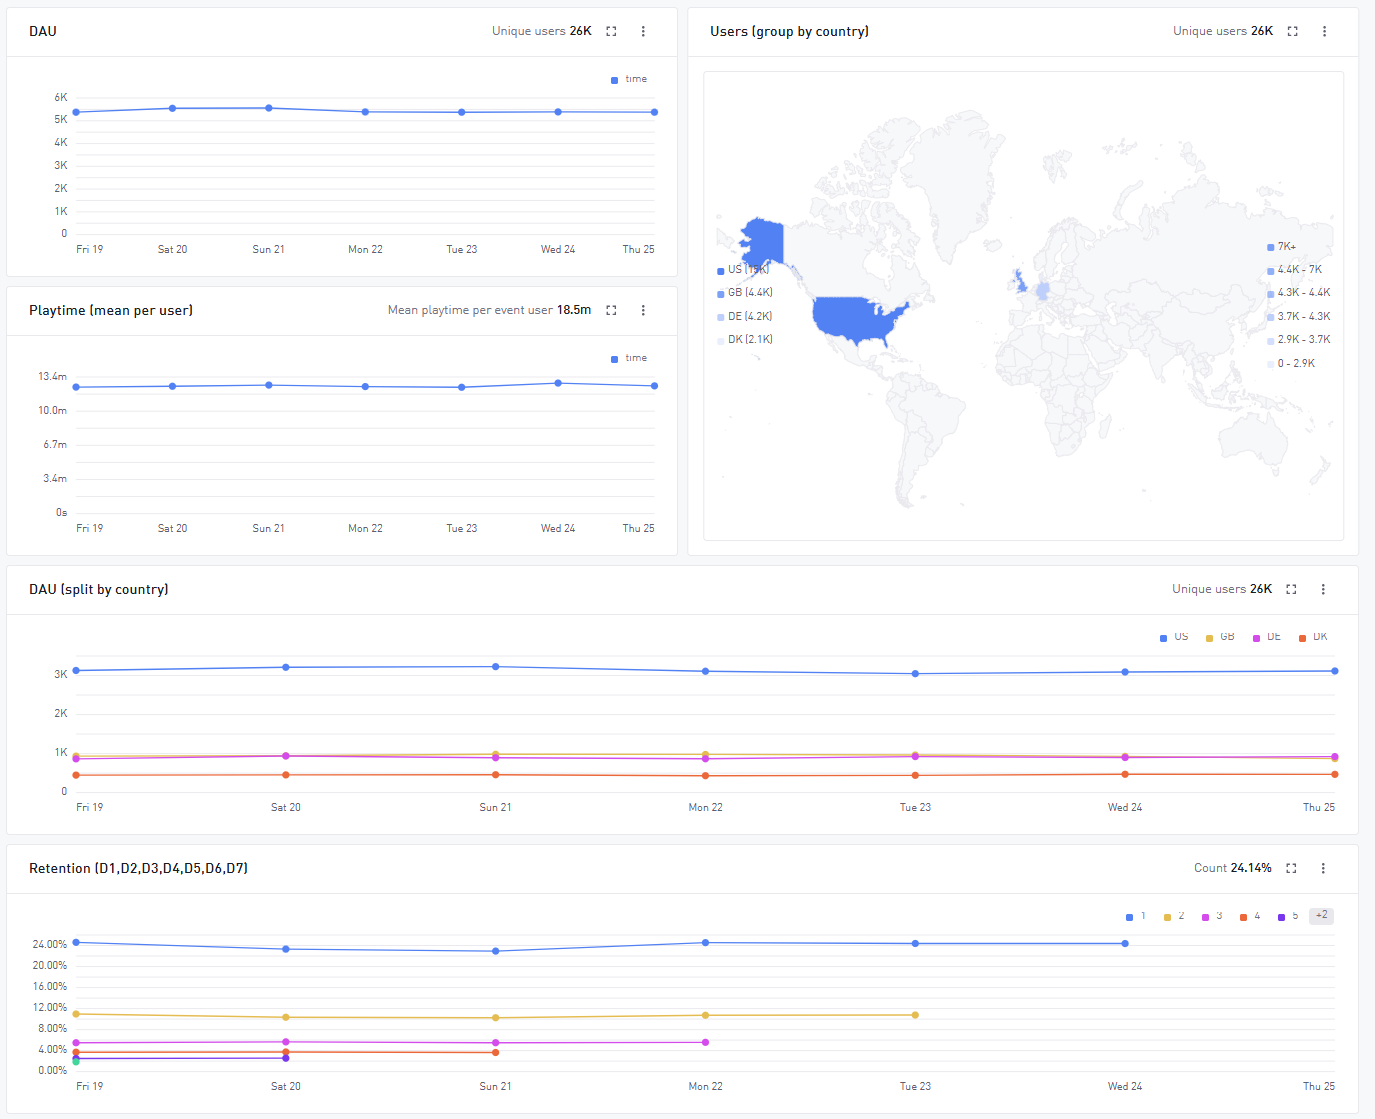
| Overview | A quick summary of your game’s performance at a glance | DAU and New Users Users by country Sessions Counts and Playtime Retention New vs Returning Users |
| Engagement | Evaluate how engaged your players are, how often they return and how long they stay | Retention (D1, 7, 30, etc.) Playtime per user and session New vs Returning Users |
| Progression | Understand how players move through your game content | Success/failure rates per level Drop-off points Completions and failed attempts |
| Monetization (IAP) | Track how much your game is earning from in-app purchases | Revenue by day, user and country ARPU, ARPPU, conversion rates Purchase types First purchasers Count of transactions |
| Ad Impressions (ILRD) | Dig into your ad revenue from mediation partners | Revenue per impression Network and country breakdowns Top-earning ad formats |
| Ad activity | See how often players engage with ads | Impressions and clicks Ad types (rewarded, interstitial, etc.) |
| Resource | Monitor how players earn and spend virtual currencies | Sinks and sources for each virtual currency Daily currency flows In-game economy transactions |
| Health | Track your game’s technical performance and stability across devices and builds | Critical FPS count Error counts by severity Affected users by error severity |
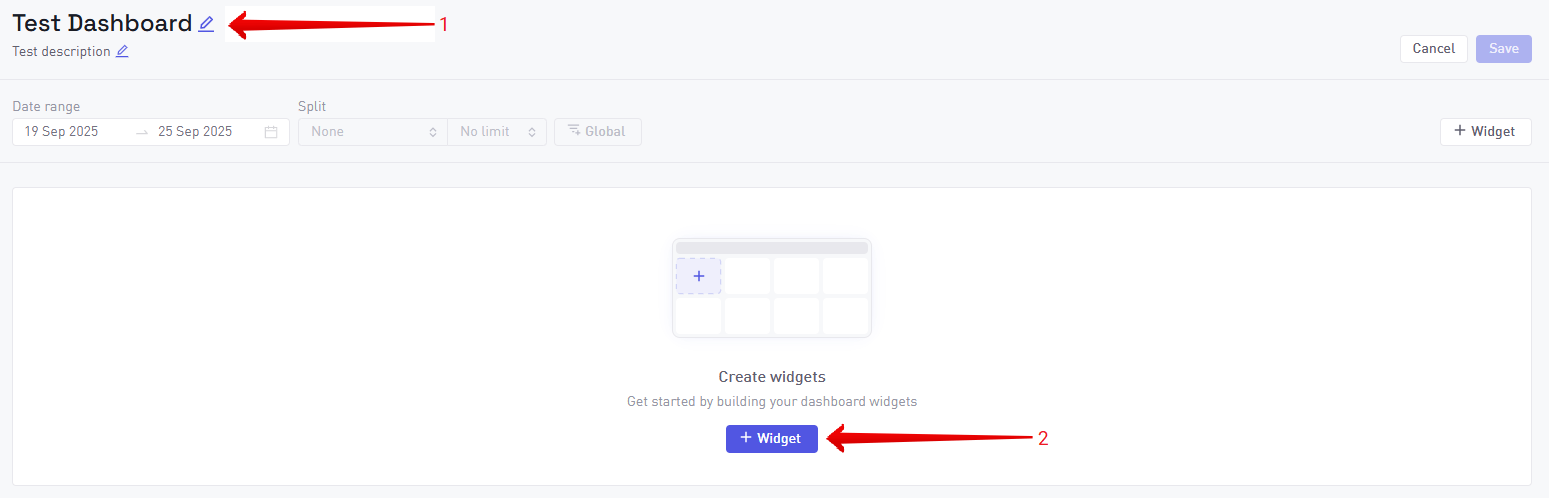
How to create a Custom Dashboard
GameAnalytics also supports the possibility of creating your own custom dashboards:
- Create your dashboard: Go to the Dashboards → Click the Create button.
- Name your dashboard: Give it a clear name and description.
- Add a widget: Click the + Widget button to create your first chart.
- Save the widget: Click Done and the chart will update based on your selections, and then Save to store the widget in a dashboard.
Custom widgets are built using the same powerful data querying capabilities used in the Explore Tool. Learn more about all the available options and how to use them here.