Overview
Realtime lets you monitor your game’s activity as it happens. It aggregates player‑event data and surfaces it in near real time, helping you validate integrations, track live user behaviour and react quickly to issues. The dashboard supports multiple time‑range views depending on your subscription and updates automatically as new events arrive.
Typical use cases
- Validate your SDK integration: confirm that events are flowing correctly immediately after implementation.
- Monitor user activity: track New, Active and Returning users through minute‑level updates across selectable time ranges (24 hours, 7‑day comparison or 15 days for Pro plans).
- Verify marketing campaigns: watch for spikes in New Users right after a campaign launch or promotion.
- Troubleshoot errors fast: pinpoint crashes or exceptions within minutes of them occurring.
- Explore raw events: inspect the latest 50 events, including their payloads, with flexible filtering.
- Audit SDK adoption: see which SDK versions are active in your game and how many events each version sends.
- Visualise geographic distribution: a world map of event origins for high‑volume, Pro‑tier games.
How to use the Realtime Dashboard
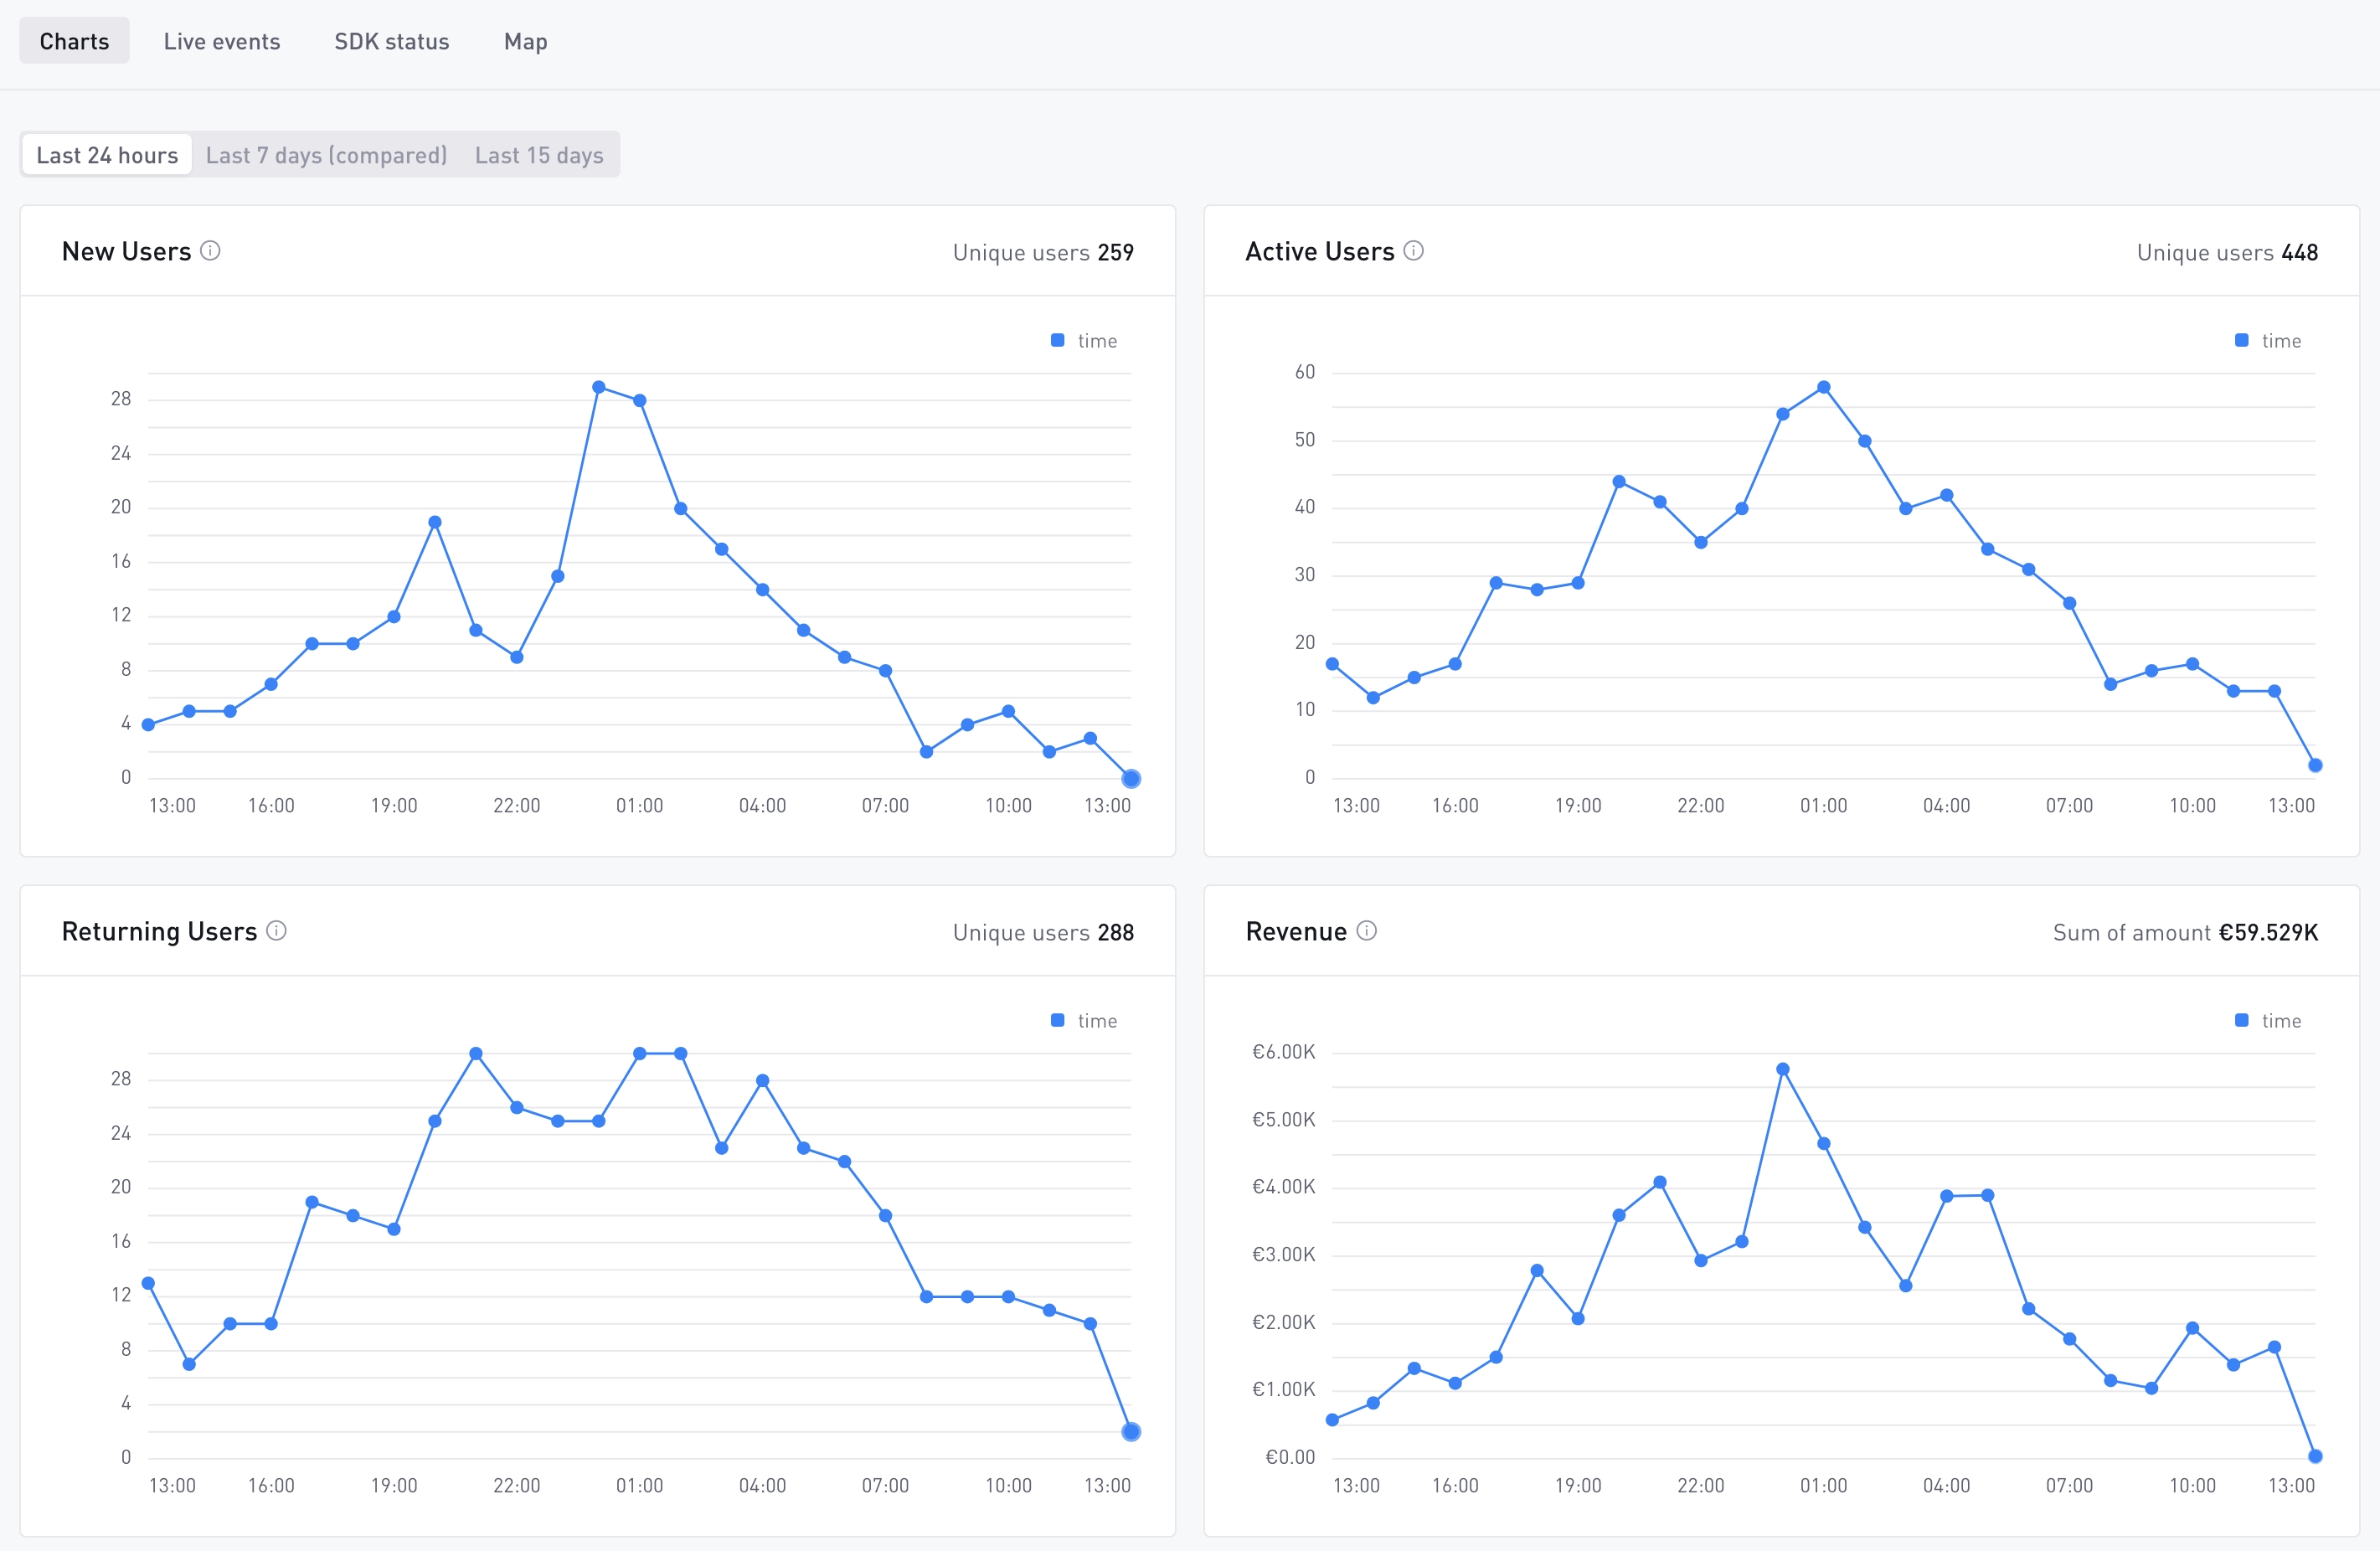
Realtime metrics
This tab displays high‑level metrics (New Users, Active Users, Returning Users, Revenue, Session Count and Errors) for the selected time range. Data points are presented at an hourly granularity.
- Time ranges:
- Last 24 hours – available on all plans.
- Last 7 days vs previous 7 days – only on AnalyticsIQ Pro. This view overlays the current week against the previous week to highlight trends.
- Last 15 days – only on AnalyticsIQ Pro for a broader horizon.
- Live indicator: a “LIVE” marker shows that the dashboard is updating. Metrics refresh roughly every minute.
- Comparison bars: in the 7‑day comparison view, a secondary series represents the prior week’s values to illustrate changes.
Use Realtime metrics to quickly verify that your LiveOps campaigns are driving the expected increase in user engagement.
Live Events
The Live Events tab streams the most recent events sent from your game. It is ideal for debugging and validating that custom events include the correct fields.
- Event stream: the last 50 events are displayed, updating automatically every few seconds.
- Pause/resume: use the Pause button to freeze the stream; click Resume to continue streaming.
- Filtering: narrow the event list using the Event Type, Build or User ID filters. Wildcards (e.g.
session_*) are supported for flexible matching. - View modes: toggle Raw JSON to display the full event payload or disable it to view a concise table with key fields.
- Syntax highlighting: event values are color-coded in both the Raw JSON and table views, so individual fields are easier to scan.
- Customize the event view: in table view, click All properties to choose which fields appear when you expand an event and the order they appear in. Your layout is saved to your account and applies across all your games.
- Export: download the currently loaded events for offline inspection.
- Copy event: click an event to copy its JSON payload to your clipboard.
- Copy a single value: when you expand an event, hover any field and click the copy icon to copy just that value.
Events typically appear within 30 seconds of being sent by the client. Only the last 50 events are retained in memory; if more events occur, older entries will roll off.
For more on syntax highlighting, choosing which properties to show and copying field values, see Advanced Usage.
SDK Status
This tab provides insight into which SDK versions are used across your player base and how they’re performing.
- Update alerts: when a newer SDK version is available, a banner will prompt you to review the changelog and upgrade.
- Metrics table: shows per‑version metrics such as Users, Total Events, Events per User, New Users, Average Playtime and Session Count.
- Adoption chart: visualises SDK adoption trends with options to view the last 14 days or 30 days. Each line represents a version; hover to see daily values.
Keep your SDK versions up to date to benefit from the latest features and bug fixes.
Realtime Map
A world map view shows where events originate from, by country, for games with high event volume.
Feature Tiers and Limitations
| Feature | Free Tier | AnalyticsIQ Pro |
|---|---|---|
| Metrics time range | Last 24 hours | Last 24 hours, Last 7 days vs previous, Last 15 days |
| Live Events filters | Available with wildcard support | Available with wildcard support |
| Live Events export | Available | Available |
| Event view customization (syntax highlighting, custom properties, copy value) | Available | Available |
| SDK Status adoption chart | 14‑day view | 14‑day and 30‑day views |
| Realtime Map | Available | Available |
| Data update cadence | ≈1 minute | ≈1 minute |
Realtime is designed for quick debugging and monitoring rather than deep historical analysis. For long‑term trends and custom queries, use Explore, Dashboards or Data Export. The time zone in Realtime reflects your Personal Settings.