Anomaly detection
Overview
Anomaly detection watches a game's key metrics for you and flags days that fall outside their expected pattern. You set up a widget for a single metric, such as DAU or revenue, and GameAnalytics checks that metric automatically every day. When a value lands outside the range the model expected, it is marked as an anomaly so you can look into it.
It is built for developers and analysts who track several metrics across one or more games and cannot watch every widget by hand. Instead of opening dashboards and deciding by eye whether a change is normal, you let the model surface the days worth a closer look.
Anomaly detection is a Labs feature. Labs features are released early while still in active development, so the scope is intentionally limited at launch and grows over time. During Labs it is available on the Pro plan only. You can try it and help shape it. See Labs for what that means and how to send feedback.
You find it under AnalyticsIQ > Anomaly detection in the left navigation. A small flask icon next to the menu item marks it as a Labs feature.
Before you start
Two conditions must be met before you can create widgets:
- A Pro plan. During Labs, anomaly detection is available to Pro users only. If you are on the Free plan, the page shows a Try PRO for free for 14 days button instead of the setup controls. Free users cannot create or view anomaly widgets while the feature is in Labs.
- At least 30 days of data. The game must have been sending events to GameAnalytics for at least 30 days. This is measured from the first event the game ever sent, not per metric. If the game is newer than that, the page shows a message telling you roughly how many days remain before you can start.
Setting up a widget
Each widget monitors one metric for one game. You can save up to 10 widgets per game (active and paused widgets both count toward the limit).
- On the Anomaly detection page, select Add widget to open the setup dialog.
- Choose the metric you want to monitor.
- Optionally enter a widget title. If you leave it blank, the metric name is used as the widget title.
- Set the confidence level with the select (see below).
- Choose the scope: monitor the metric across all players (global), or apply a filter to monitor a specific dimension.
- Select Add widget. The wdiget is added to the page and daily detection starts for it.
When you reach 10 widgets on a game, the Add widget button is disabled. To add another widget, delete one first.
Anomaly detection runs on each widget for 90 days from the day you create it, then pauses automatically. See The 90-day detection period below. A reminder of this is shown on the widget when you save it.
Confidence level
The confidence level controls how strict detection is. The select has seven fixed options: 70%, 80%, 90%, 95%, 97%, 98%, and 99%. The default is 90%.
- A higher confidence level is stricter. The expected range is wider, so only larger deviations are flagged. You get fewer anomalies.
- A lower confidence level is more sensitive. The expected range is narrower, so smaller deviations are flagged. You get more anomalies.
Metrics you can monitor
During Labs you can set up widgets for these metrics:
| Metric | What it tracks |
|---|---|
| DAU | Daily active users. The unique user count reported per day. |
| New users | Count of unique users observed for the first time (events sent) reported per day. |
| Returning users | Count of unique users who were previously observed in the past (events sent) reported per day. |
| Paying users | Count of unique users who sent at least one business (IAP) event. |
| Revenue (IAP) | Sum of revenue for IAP transactions (business events). |
| Converted users | Count of unique users who converted to paying since install (sent at least one business event). |
| Transactions | Count of IAP transactions (business events). |
| First transaction count | Count of transactions (IAP) being the first observed for a user (converting) reported daily. |
| Errors | Count of error events. |
| Errors per session | Mean count of errors per unique session (having error events). |
| Critical error per session | Mean count of errors per unique sessions having critical severity. |
| Error users | Count of unique users who sent at least one error event. |
| Errors per user | Mean amount of errors per unique user sending error events. |
| Critical error per user | Mean count of critical errors per unique user sending error events. |
| Ads clicked | Count of ads (ad event) having the ad action equal to clicked. |
| Ads clicked per session | Mean count of ads (ad event) per session having the ad action equal to clicked. |
| Ads clicked per user | Mean count of ads (ad event) per user having the ad action equal to clicked. |
| Total Ads display failed | Count of ads (ad event) with ad action equal to failed_show. |
| Total Ads shown | Count of ads (ad event) with ad action equal to show. |
| Ads shown per session | Mean count of ads (ad event) per session (having ad events) with ad action equal to show. |
| Ads shown per user | Mean count of ads (ad event) per user (sending ad events) with ad action equal to show. |
| ILRD Count | Count of ad impressions (ILRD). |
| ILRD Revenue | Sum of revenue for ad impressions (ILRD). |
| ILRD Revenue per active user | Mean revenue (ILRD) per active user. The ILRD revenue sum divided by the active user count. |
| ILRD Revenue per impression | Mean revenue (ILRD) per impression event. |
| ILRD Revenue per user | Mean revenue (ILRD) per event user. The ILRD revenue sum divided by the count of users sending at least one impression event. |
| Level attempts started | Count of level attempts (progression event) with status equal to start. |
| Level attempts failed | Count of level attempts (progression event) with status equal to fail. |
| Level attempts completed | Count of level attempts (progression event) with status equal to complete. |
| Virtual currency flow | Flow uses the resource event to report a sum of sourcing currency (positive) and sinking currency (negative) showing the virtual economy balance. |
| Virtual Currency Earn | Sum of amount from resource events with flow type equal to source. |
| Virtual Currency Spend | Sum of amount from resource events with flow type equal to sink. |
| Session Count (started) | Count of sessions (session start event). |
| Session Count (ended) | Count of session end events. |
| Playtime per session | Mean playtime (length) per unique session end event. |
| Playtime per user | Mean playtime (session end length) per unique user sending session end events. |
| iOS Users Consent Authorized | Count of unique users sending iOS ATT consent-status equal to authorized reported per day. |
| Custom event count per session | Mean count of custom events (design events) per session (having design events). |
More metrics are expected in later releases.
Reading the main page
The Anomaly detection page lists all of a game's saved widgets, stacked in the order you created them. Every widget on this page uses a fixed range of the past 90 days, so there is no date picker here.
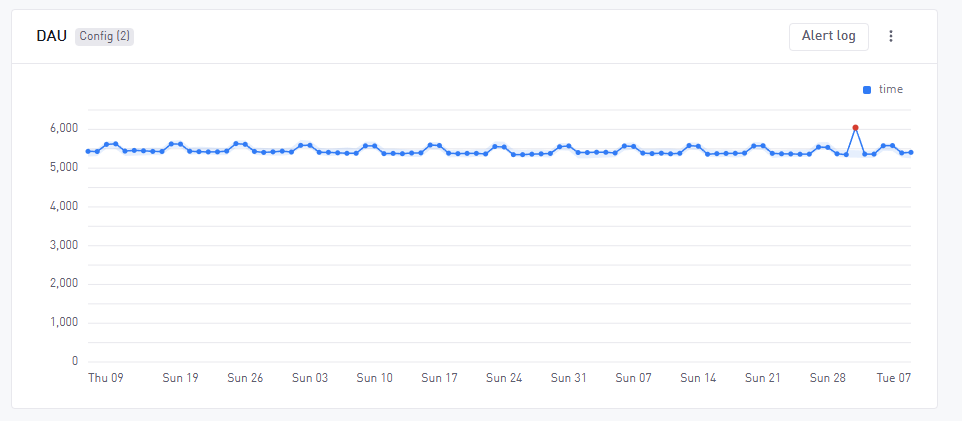
- Widget card. Each widget shows the metric as a line, a shaded band for the range the model expected, and a red marker on any day that fell outside that band. A list beside the widget shows the same anomalies. Hover a marker to see the date, the actual value, the expected range, how far off it was, and the direction. Selecting an item in the list highlights its marker on the chart.
- Config badge. The card header shows a badge with the number of configuration items for the widget. Hover it to see the metric, confidence level, and any active filter.
The alert log
Each widget card has an Alert log button that opens a fullscreen view of that widget's recorded anomaly history. Unlike the main page, the alert log lets you change the date range using the standard GameAnalytics date picker with 90 days window.
The alert log shows the metric as a plain line with a marker on every day an anomaly was recorded. There are no expected-range bands in this view. You can switch between the widget and a table of the anomalies (date, direction, actual value, expected baseline, and deviation), sort the table, and export the data. A left panel lists all the game's widget with a badge showing how many anomalies each has in the selected range, so you can move between them without leaving the view.
The alert log only holds anomalies from the day you created the widget onward. On the day you create a widget it has no entries yet. A notice on the view tells you the date detection began, and on creation day it adds that the first anomalies will be available the next day.
The main page and the alert log can show slightly different anomalies for the same widget. This is expected. The main page runs a fresh analysis of the past 90 days every time you open it, so it reflects the metric as it looks right now. The alert log is the record of what the daily automated check found since you set the widget up. Use the main page to see the current picture, and the alert log as the historical record.
The 90-day detection period
Detection runs on each widget for 90 days from the day you create it. When the 90 days are up, the widget pauses automatically and stops recording new anomalies. Editing a widget does not restart this clock; the 90 days always run from the original creation date.
A paused widget is not deleted, and its alert log stays available. To start detection again, from the widget click Reactivate. This begins a new 90-day period from that date. Reactivating does not count as an extra widget, so it is always allowed within your 10-widget limit.
If your organization moves from Pro back to Free, your widget are kept but hidden, and the page shows the Pro trial button. They return automatically if you upgrade to Pro again.
Deleting widgets
Widgets are read-only by default so you do not change them by accident. Deleting a widget asks you to confirm first, and cannot be undone.
Trying it in demo mode
If you do not yet have access, demo mode lets you explore anomaly detection. You can create/remove widgets. Widgets you create in demo mode last only for that session and are not saved.
What is coming next
Anomaly detection is an early Labs release, so more is planned. Items under consideration for later versions include Free plan access, email and Slack notifications, root-cause breakdowns by dimension (such as country or platform), and more metrics. If there is something you need, let us know through the Labs feedback channel; it helps us decide what to build next.
Related resources
- Labs - what Labs features are and how to give feedback
- Health - monitor crashes, performance, and session quality
- Monetization - track and analyze revenue across your portfolio