Distributions
Overview and Use Cases
Distributions help you visualize the full spectrum of player behavior in histograms. These visualizations can help expose outliers and long tails to support making more nuanced decisions beyond averages or medians.
Use Case Examples:
- Acquisition
- Engagement
- Monetization
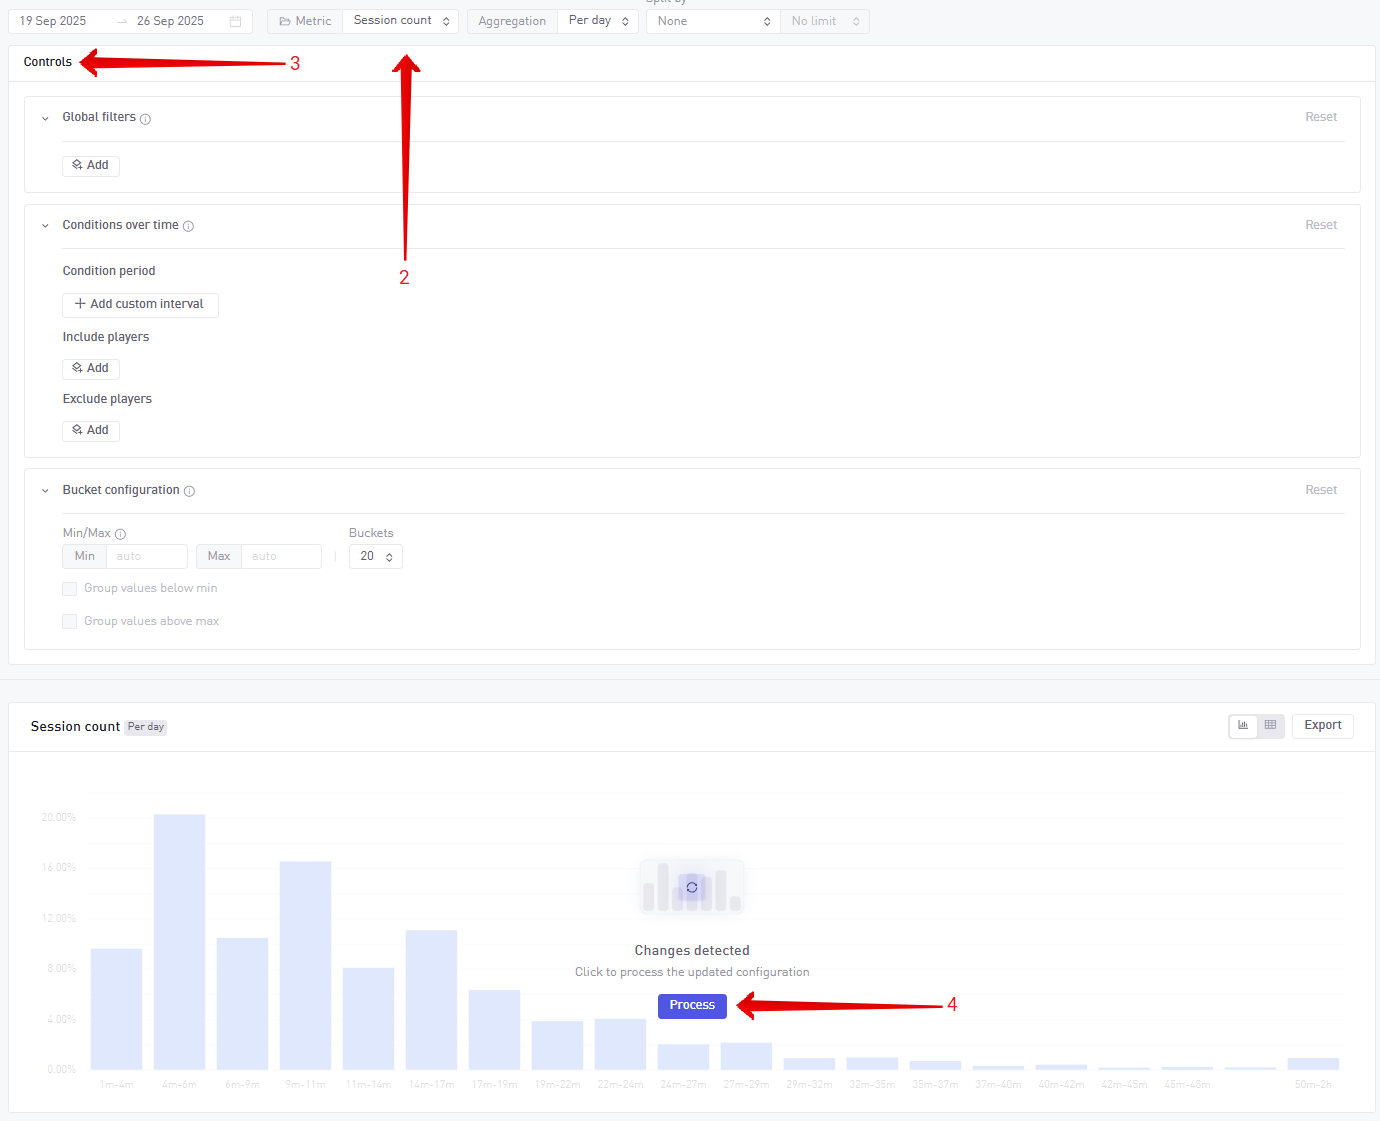
How to use Distributions
- Navigate to Distributions
- Choose your metric (e.g. Playtime, Revenue, Ad Impression count)
- Configure your bucket settings controls: Global filters, Conditions over time, Bucket configuration
- Click the Process button on the graph to update the results
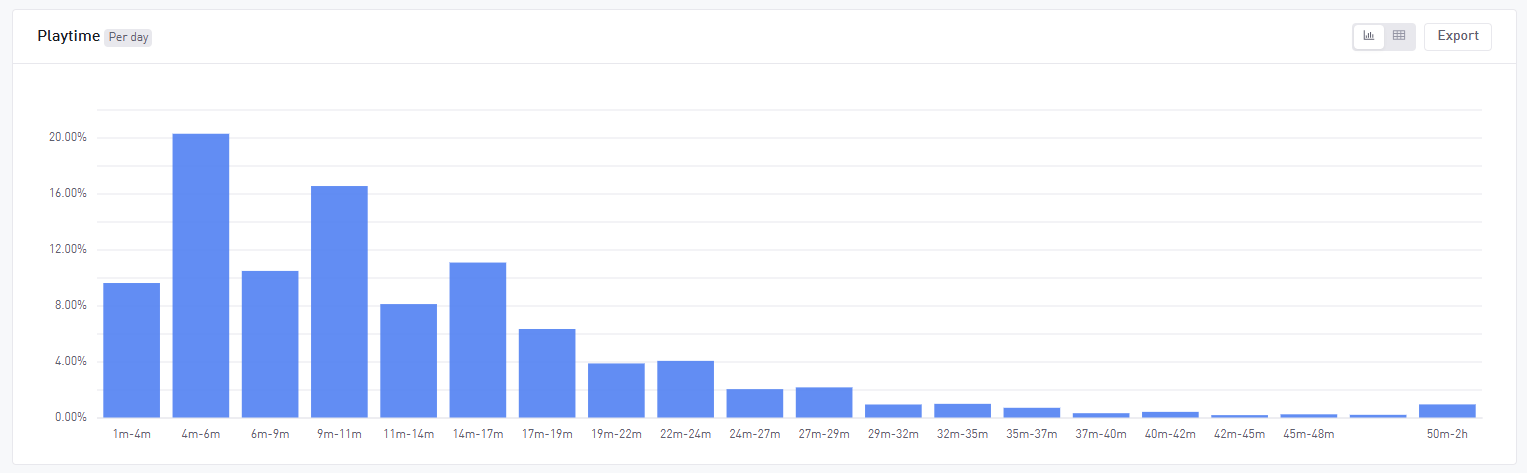
Analyzing Distribution Results
The Distribution chart shows:
- Y-Axis (Percentage of population): Shows the percentage of users in each interval.
- X-Axis (Intervals): Shows the distribution of users by intervals
Best Practices & Tips
- Start with default buckets, then refine as you explore patterns.
- Use global filters to narrow down to specific users
- Avoid using too many buckets, which can obscure patterns.