Engagement Matrix
Overview and Use Cases
The Engagement Matrix helps you analyze how widely and frequently different features or actions are used. Unlike Cohorts or Retention, which track returning behavior, the Engagement Matrix highlights how active users are across tracked events – revealing both the breadth (how many users engage) and frequency (how often they engage).
Use Case Examples
- Evaluate level completion rates: Analyze progression events to identify which levels are most commonly played, how often and by what percentage of your users.
- Monitor feature adoption: Track usage of new features (e.g. shop, social system, live ops events) to see how many players try them and how often they return to use them. High breadth but low frequency could indicate curiosity without sustained engagement.
- Identify underused content: Spot features or mechanics with low usage across the board – both in terms of reach and repeat interactions. These may need UX improvements, better onboarding or live ops support.
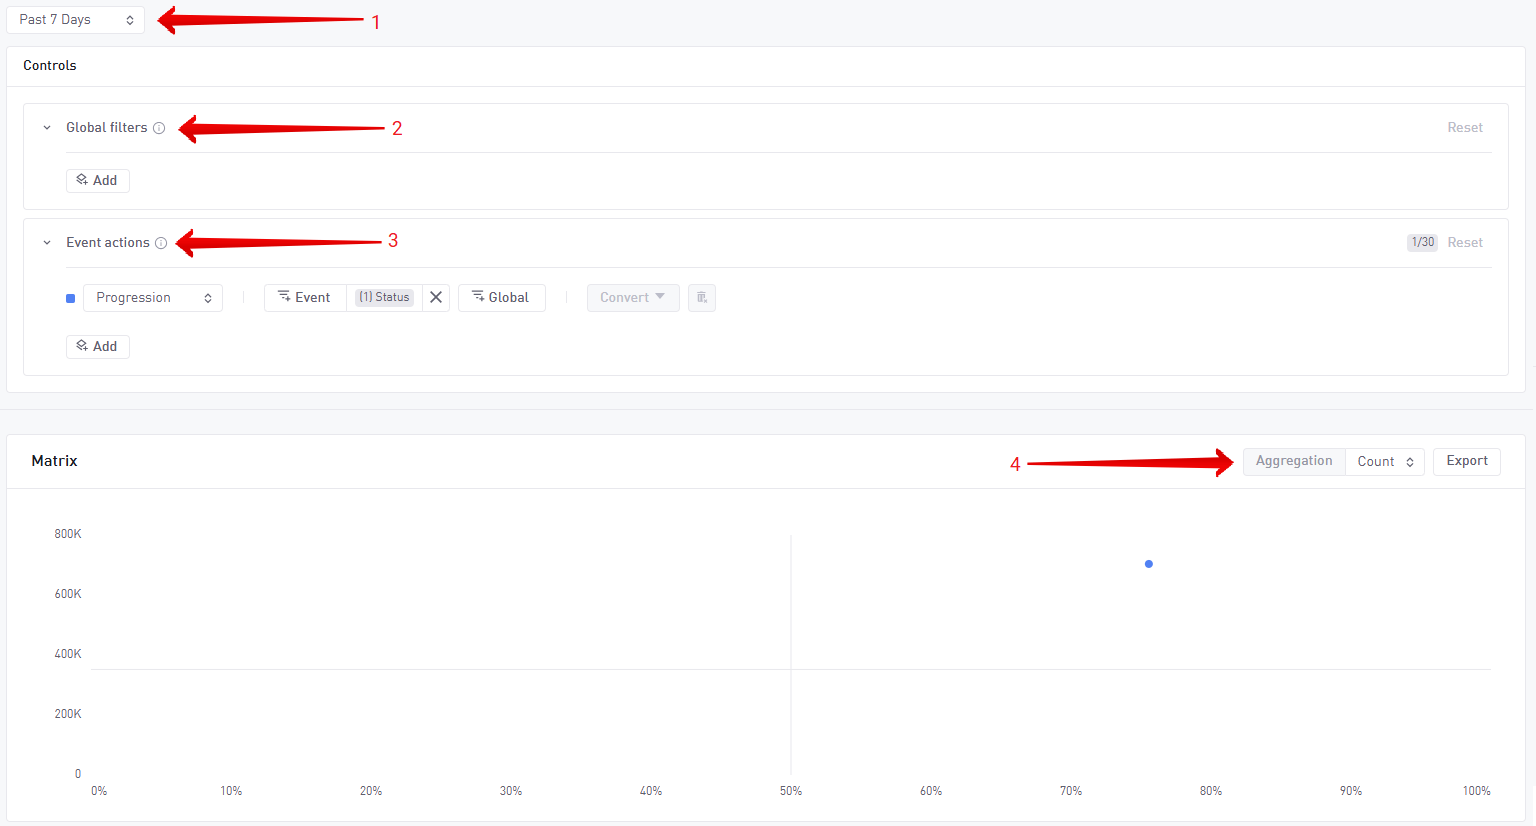
How to use Engagement Matrix
- Select a time period: Use the drop-down to choose a date range (e.g. past 7 days, past 30 days, etc.) for your analysis.
- Select event actions: Choose the specific triggered events you want to evaluate (e.g. progression_compete, shop_opened, ad_reward).
- Apply filters: Refine your analysis with filters like country, platform or acquisition channel.
- Choose aggregation: Select how you want the frequency to be calculated:
- Count: Total number of occurrences
- Unique users: Number of distinct users who triggered the event
- Mean count per user: Average frequency per active user
Analyzing Engagement Matrix Results
The Engagement Matrix chart shows:
- Y-Axis (Frequency): Shows the frequency of use, depending on the aggregation chosen.
- X-Axis (Breadth): Shows the percentage of users who triggered the event at least once during the selected period
- Each event is shown as a point on the matrix, allowing you to quickly compare usage patterns across features or dimensions.
info
When analyzing feature usage:
- High breadth and high frequency → core mechanics
- High breadth and low frequency → tried but not adopted
- Low breadth and high frequency → niche but sticky features