Cohorts
Overview and Use Cases
Cohorts help you understand how new users behave over time, based on when they first installed your game. It’s especially valuable in spotting early lifecycle patterns and identifying differences in engagement and monetization between groups of users.
Use Case Examples
- Campaign optimization: Track retention and revenue for users who installed during specific periods.
- Feature launch performance: Measure the impact of new features on engagement and spend for install cohorts.
- Platform, country or build comparison: Compare how cohorts behave across platforms, countries or builds.
- Identify high-performing cohorts: Spot cohorts showing high Day 1 retention, early purchases or higher session counts for further UA and live ops targeting.
How to use Cohorts
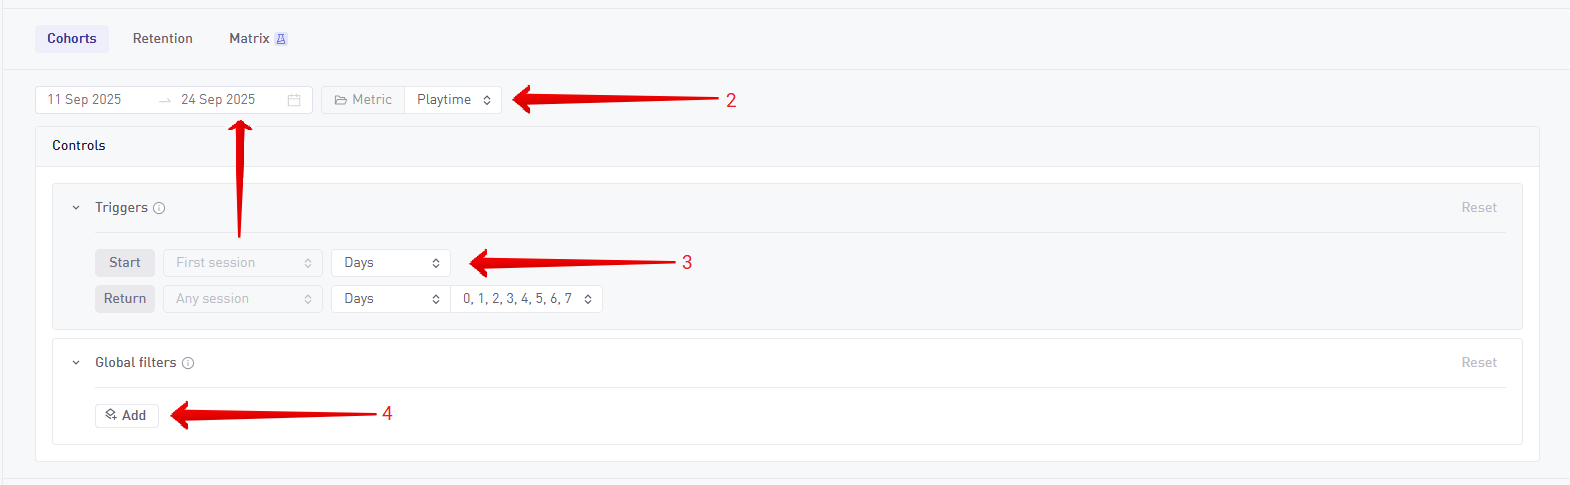
- Select install period: Use the date picker to choose a time window (e.g. last 7 days, last 30 days, or specific dates) for your analysis.
- Select metric to analyze: There are 40+ available. For example, choose Revenue (IAP) to see how players are spending each day since install.
- Choose cohort/return groupings: Determine whether you’d like to see daily or weekly install cohorts and return periods, e.g. Day → Day, Day → Week, Week → Week, etc.). Daily is based on calendar day, while weekly is a 7-day period based on start date.
- Apply filters: Refine your analysis with filters like country, platform or acquisition channel. Note: Only filters that don’t change post-install are supported.
Analyzing Cohorts results
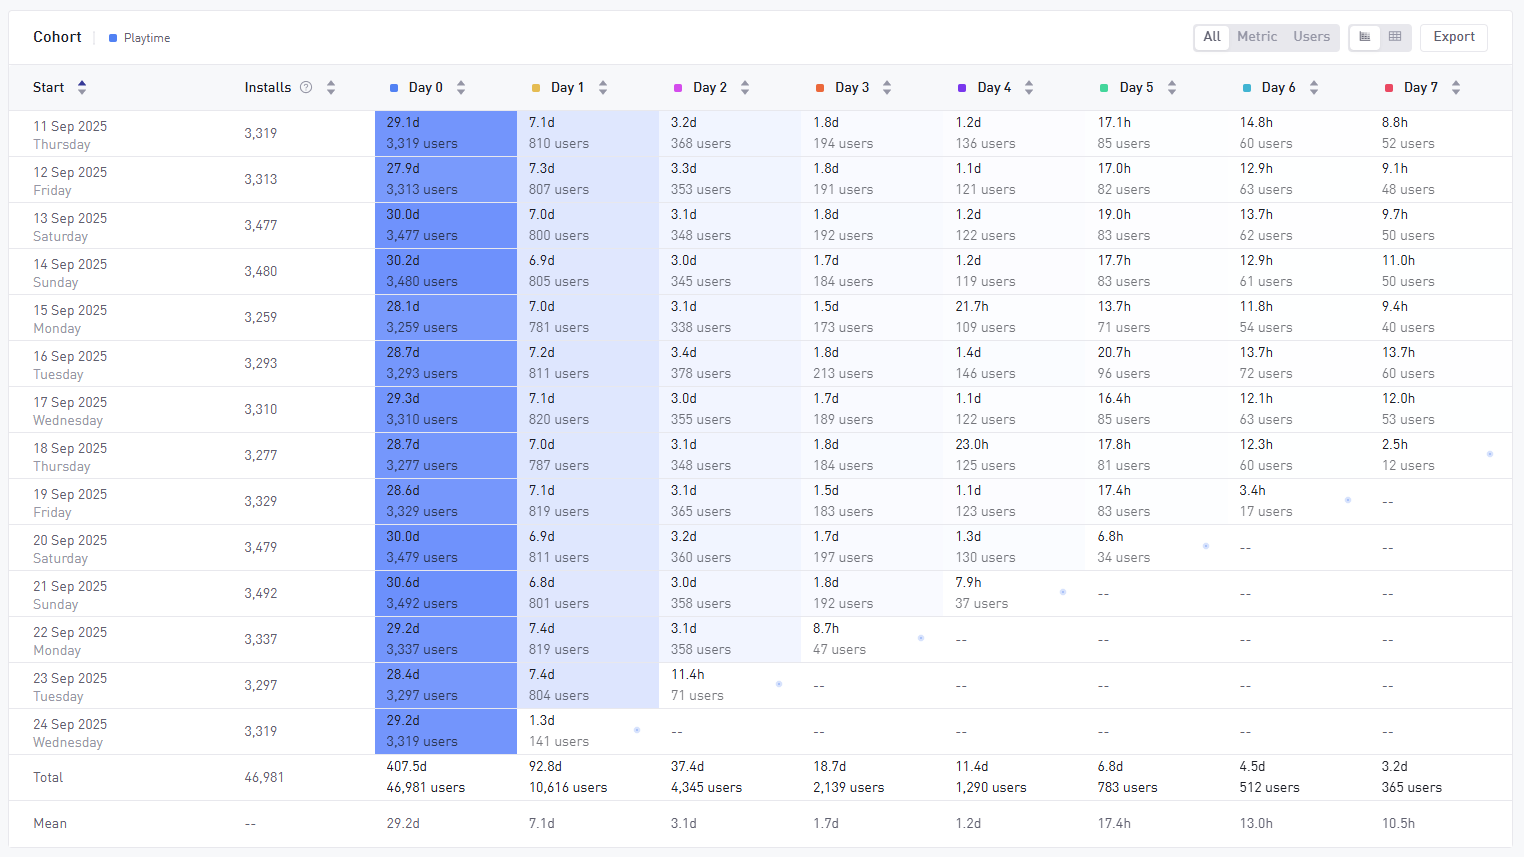
The Cohort table shows:
- Rows = install periods (days or weeks)
- Columns = return intervals (e.g. Day 1, Day 3, Week 1, etc)
- Cells = the metric values for that interval
Metrics behavior
- Standard metrics: Show what users did on that specific return day/week.
- Cumulative metrics: Show the sum of activity from install through the return interval.
- You can toggle the display to show metrics, user counts or both
info
The Cumulative Revenue metric for a cohort is an indicator of lifetime value (LTV) – or the value of the cohort of users to date.
Visual aids and table controls
- Pulsating blue dot: Signals that the time period (day/week) is still in progress, so the data shown may be incomplete.
- Heatmap view: Enabled by default to highlight peaks and dips in metrics.
- Footer row: Displays summary statistics, including total (for sum/count metrics) and mean (for average/ratio metrics) per interval.
- Export to CSV: Download the table of data for further analysis.