Health
Overview and Use Cases
The Health dashboard in AnalyticsIQ provides a comprehensive view of your game’s technical stability, performance and player experience. It helps you monitor crashes, performance metrics and session quality – so you can proactively detect and resolve issues that impact player satisfaction.
Use Health to
- Ensure stability across platforms
- Maintain smooth gameplay
- Catch performance issues early to reduce churn and negative reviews
- Empower your team with real-time data to debug, test and validate optimizations
Use Case Examples
- Evaluate build performance: Detect a spike in crash reports after releasing a new build
- Optimize platform performance: Compare boot time across Android and iOS to identify slow launch paths
- Optimize device performance: See which devices drop below acceptable FPS thresholds
The Health feature reports metrics based on Error events, Performance and SDK init events, sent from your game. Certain platforms can send this automatically if enabled, while others require manual implementation. Refer to our documentation for more information.
Analyzing Health Results
| Data Point | Definition | Dashboard |
|---|---|---|
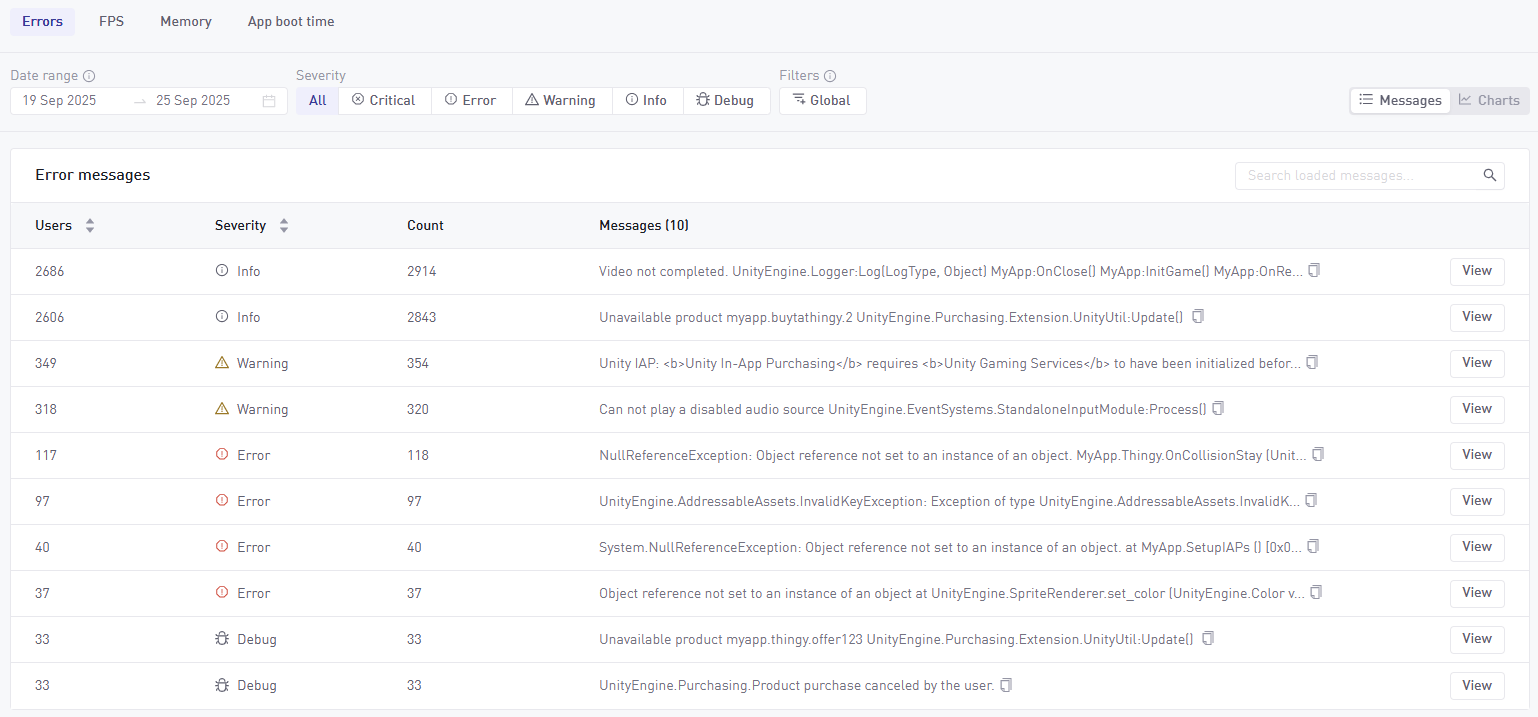
| Errors (mean per user) | Average error events per user | Error |
| Error users | Unique users that have experienced at least one error event | Error |
| FPS | Distribution of samples sent for each frame per second (FPS). X-axis shows count of samples sent per FPS, samples are collected and averaged every second. | FPS |
| Experience | Shows the median FPS from your application over the past 30 days, on the scale of 1-120 FPS. | FPS |
| Device memory usage | The percentage of device total memory in use during sessions. | Memory |
| Application memory usage | The percentage of the device's total available memory used by your app. | Memory |
| General launch time | Time, in milliseconds, from the start of the application and until the GameAnalytics initialize call is triggered. | App boot time |
| First launch time | Shows boot time when the app was launched for the first time. | App boot time |
Range Filtering & Buckets
Range Filtering: Allows you to limit the results to values within a specific range – so you can narrow your analysis to a performance threshold or problem zone. Buckets: : By changing the number of buckets, you can increase or decrease the granularity of groups to better understand the distribution of values.
Best Practices & Tips
- Use filters (e.g., country, build, platform) to isolate specific performance issues by segment.
- Check Health after every release to catch regressions early.
- Prioritize critical errors by user impact — use "error users" to focus on high-severity crashes.
- Benchmark boot time and memory usage across top-performing builds to set performance targets.
- Review critical FPS counts in combination with progression or session drop-off data, to see if performance affects retention.