Explore
Overview and Use Cases
Explore is your analysis workspace – designed for a deeper look into your data. It uses our powerful Query Builder, and allows you to save, compare and export data as needed.
- Dig deeper, slice and dice: Build queries with aggregations, filters and dimensions using the Query Builder.
- Views: Save your queries as a View to visit later.
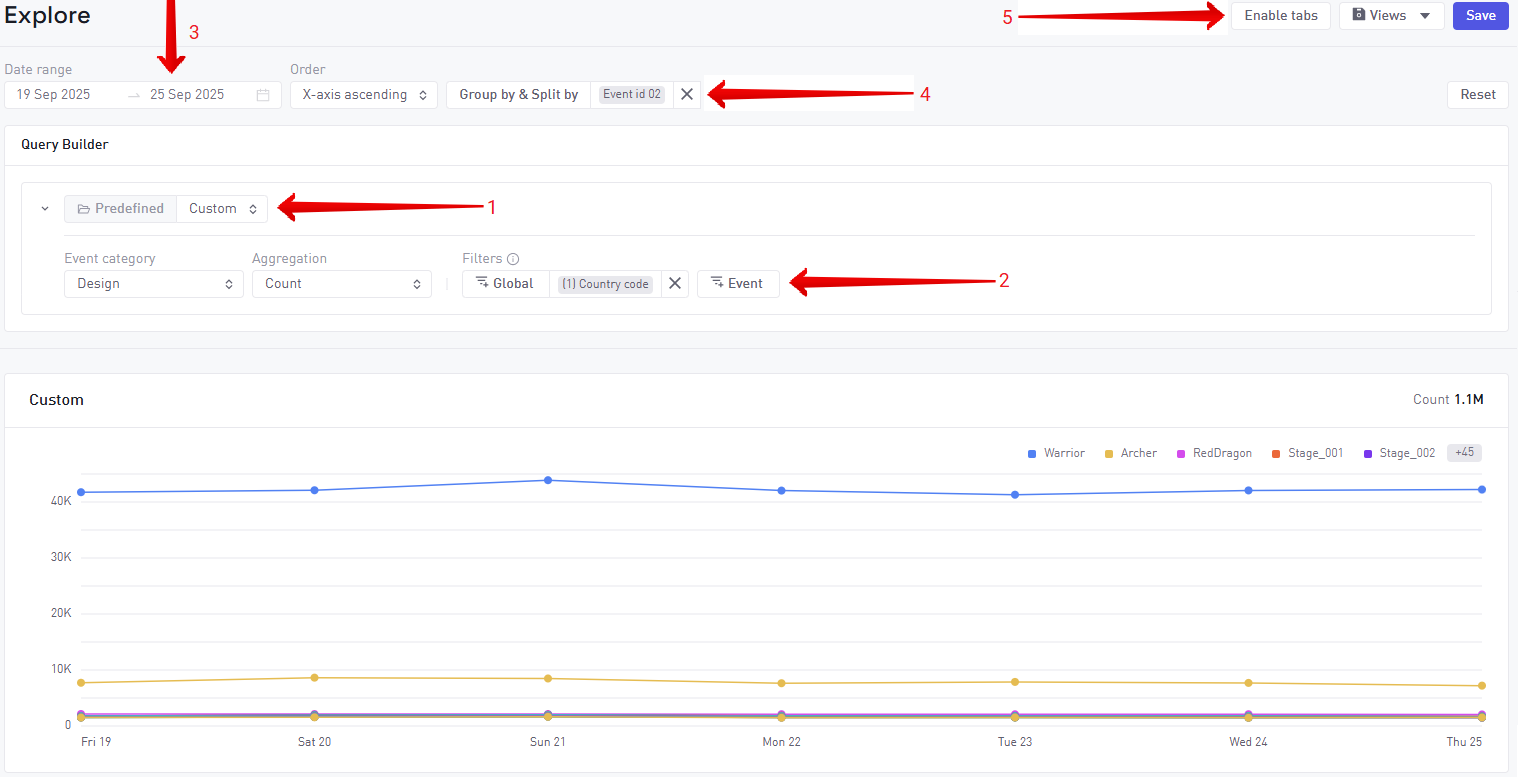
- Tabs: Compare up to 3 queries side by side with the Enable Tabs → Compare option.
- Table Export: View results in a tabular format and download as CSV (comma, semicolon, colon, or tab–delimited)
Suggested flow when using Explore
- Pick a predefined metric or build a custom metric (by selecting an event category + aggregation).
- Add Global filters (e.g., country = US, platform = Android) and Event filters (e.g., progression status = Start, IDs 1–4).
- Select a date range.
- Group by and split (e.g., status by world).
- Save the view for regular use in the Explore Tool or as a widget in your Custom Dashboards.
The Explore feature has a number of options available to drill in to your specific users.
How to use Explore
Metrics Selection
Explore allows for quick access to a list of predefined metrics. Most of these metrics are shortcuts and they can be created manually by specifying all the different query parameters needed.
Some metrics are marked Unique as these require specific calculations beyond what is manually configurable. They often have some limitations in terms of filtering and other options when selected.
Event category selection
To start creating your own metric manually you would start by selecting an event category. These categories correspond to the event-types (link to page) sent from the game. For example to build a query having insights into IAP purchase revenue you would select "Business" as the Event category, as this contains information about IAP. Options in the query builder can unlock once certain events are selected. Like specific aggregations and event-filters.
Aggregation
Use this option to change the calculation depending on how you want to analyze your chosen event type.
| Global Aggregations | Event Aggregations |
|---|---|
| Available regardless of what type of event is selected | Aggregations that are specific to event types Most event types allow sending a numeric value in addition to the event id strings, e.g. Business events include the purchase amount, and Progression events include the score. The Event Aggregations allow you to calculate metrics based on these numeric values. |
| Count: count of events Unique Users: count of unique users Unique sessions: count of unique sessions Mean count per user Mean count per event user: average count per users that send the event type Mean count per session | Sum of amount Mean amount per event Mean amount per session Mean amount per event user Mean amount per active user Weighted mean amount per user (Only possible when Group By is set to All) Weighted mean amount per session (Only possible when Group By is set to All) |
Filters
| Global Filters | Event Filters |
|---|---|
| Country Build Device Custom dimensions Acquisition data | Ad: type, placemente, failure reason Business: item type, ID, receipt status Progression: status world/level IDs Error: severity, message |
Both types of filters support logical combinations:
- AND across filter types
- OR within multi-value settings per filter
- Support exclusions and nested logic
Group by & Split
Use Group By & Split to further segment your data, breaking it down by meaningful dimensions to help you uncover patterns and compare performance.
Group By will aggregate the data along the X axis (horizontal). You can group by:
Split adds a secondary dimension to your analysis – aggregating data along the Y axis (vertical), allowing for multi-line or stacked charts.
Applying Limits
Limit controls the maximum amount of unique strings returned from the calculation, when Group by or Split is active. If a specific dimension has more unique values in the data compared to the limit, then the top values are selected and some will be excluded.
- Group by only: Can support up to 1000 unique values returned
- Split only: Supprots up to 1000 unique values returned
- Group by & Split: Supports up to 50 unique values returned
Examples
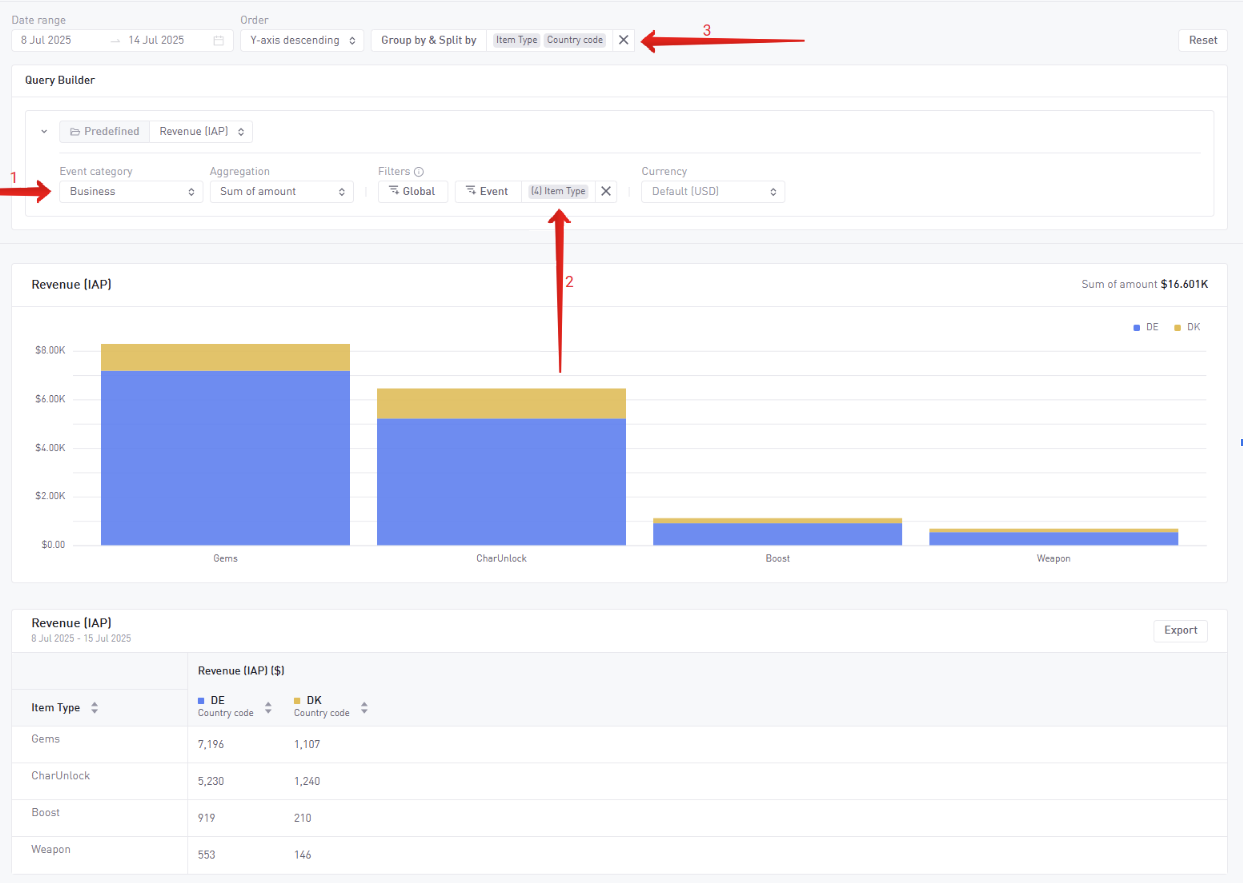
Revenue per day, grouped by items, split by country
- Navigate to the Query Builder from the Explore Tool or Custom Dashboards.
- Set the Event Category → Business Events and the Aggregation → Sum of amount to calculate total revenue.
- Go to Event Filters and select the Item type filter (exclusive to Business Events) you want to analyze. For this example we will pick all 4 available item types, to analyze how much revenue they generate.
- Next, go to Group by & Split
- Group by Event dimension → Item type.
- Split by Global dimension → Country code.
- Click Apply.
Once this is done the visualization will change to a bar chart showing revenue for each item type by country.
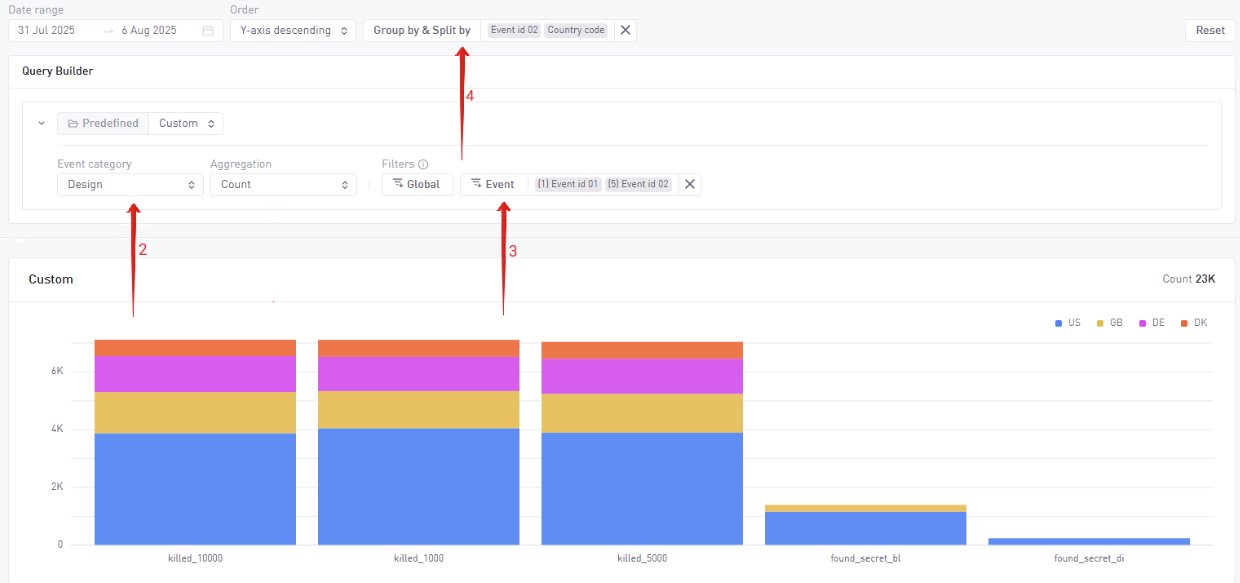
Number of achievements gained per day, split by country and grouped by achievements
- Navigate to the Query Builder from the Explore Tool or Custom Dashboards.
- Set the Event Category → Design Events and the Aggregation → Count to calculate total revenue.
- Go to Event Filters and select the IDs you want to analyze. For this example we will pick event ID1 and 2 as they correspond to our achievement events.
- Next go to Group by & Split
- Group by Global dimensions→ Country code.
- Split by Global dimension → ID2 (as this holds our individual achievement strings).
- Click Apply.
Once this is done the visualization will change to a bar chart showing the count achievements unlocked per country.