Retention
Overview and Use Cases
Retention helps you understand how well players return to your game after performing a specific action – not just after install. While standard D1/D7 retention shows general stickiness, this feature lets you ask deeper questions into post-install and post-event behaviors.
This level of analysis is made possible by:
- Custom Start and Return Triggers: Allow you to calculate retention and return rates based on any tracked event (e.g. progression_complete, business_transaction, session_end)
- Event Actions: Allow you to further filter the user group to only those who performed a specific action during a time window.
Use Case Examples
- Measure success of onboarding: Show return rates of users after tutorial completion
- Feature effectiveness: Analyze retention after key design events
- Monetization-focused retention: View return rates after first purchase
- Engagement impact of new features: Retention after feature-specific usage
How to use Retention
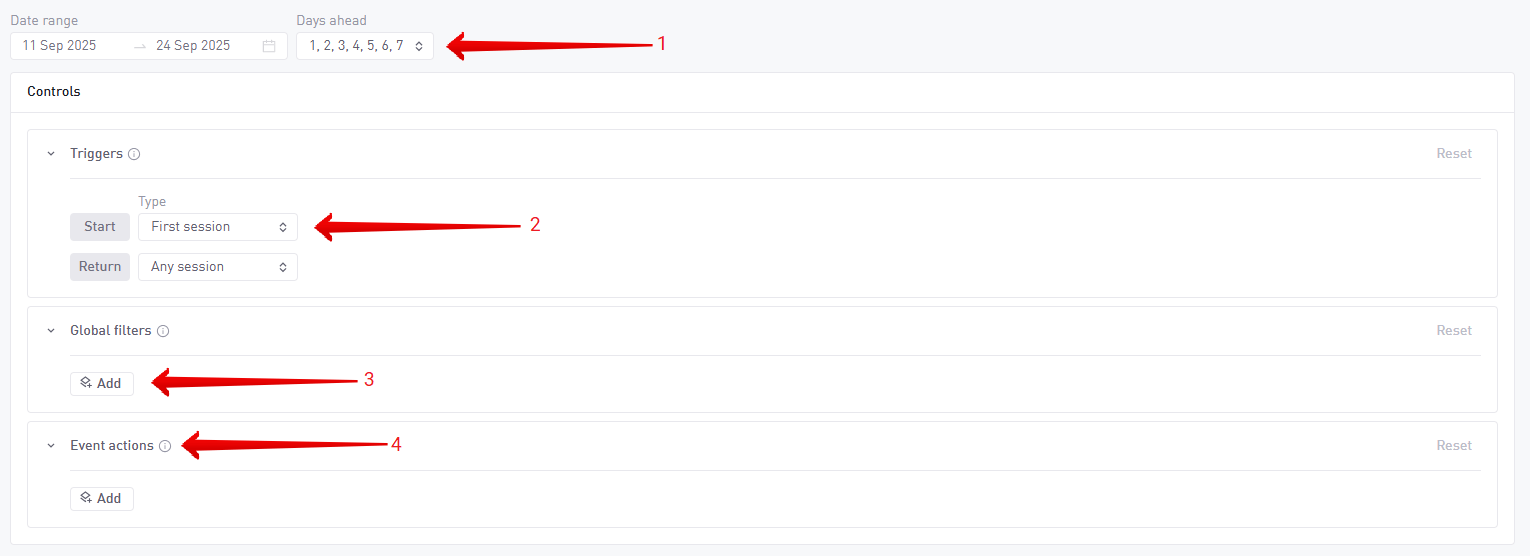
- Select a time period: Use the date picker to choose a date range (e.g. last 7 days, last 30 days, or specific dates) for your analysis. Then set your days ahead, to define the specific return periods you would like to see (e.g. players that returned on Day 1, Day 6, Day 30, etc. You can select up to 9 periods).
- Define your triggers
- Start: Defines the first action players have taken when calculating retention/return rates. The default Start Trigger is First Session, with the possibility to change it to any Resource, Progression, Design or Business event (e.g. making an IAP, completing a level, buying a weapon).
- Return: Defines the return action players have taken when calculating retention/return rates.
- Apply Global Filters: Refine your analysis with filters like country, platform or acquisition channel.
- Apply Event Actions: Filter which users are included in the calculation, based on specific behavior they have performed during the selected time period
info
You can mix event types for Start and Return Triggers (e.g. Start: tutorial_complete, Return: session_start).
| Measurement | Start Trigger | Return Trigger | Event Action |
|---|---|---|---|
| Return rates of users after tutorial completion | Event condition → Progression Event Filters:
| Any session | - |
| Return rates of users who purchased the starter pack | Event condition → Business Event Filters:
| Any session | - |
| Return rates of users who purchased the start pack as their first purchase, and returned to make another purchase | Event condition → Business Event Filters:
| Select Event → Business Event Filters:
| - |
| Return rates of users after using a specific feature (e.g. battle pass) | Event condition → Design Event Filters:
| Any session | - |
| Percentage of installs making a purchase X days later | First Session | Select Event → Business Event Filters:
| - |
| Percentage of installs making a purchase X days later, who also completed the tutorial | First Session | Event condition → Business | User sent → Progression Event Filters:
|
Analyzing Retention results
Retention is displayed on the chart title when the start condition is First Session. User Return Rate is displayed when using a custom start trigger.
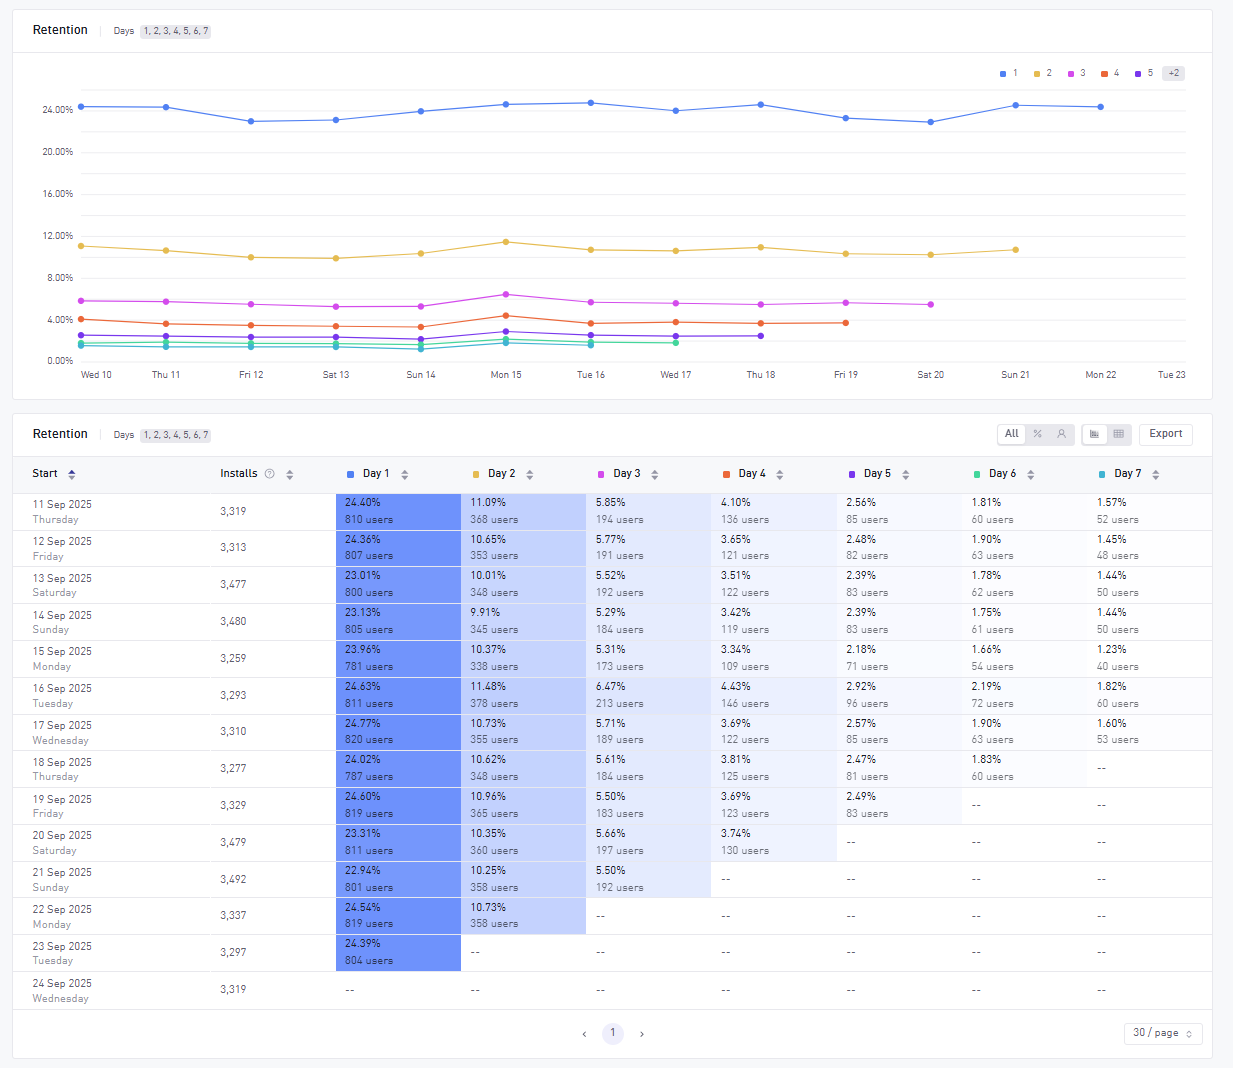
The Retention chart plots Retention/Return Rates across the selected days ahead.
- X-Axis: Return date (i.e. the date on which players triggered the return condition)
- Y-Axis: Percent of players that returned (i.e. triggered the Return condition)
- Data Points: Retention or Return Rates (i.e. the percent of players that triggered the Return conditional this date, split by X)
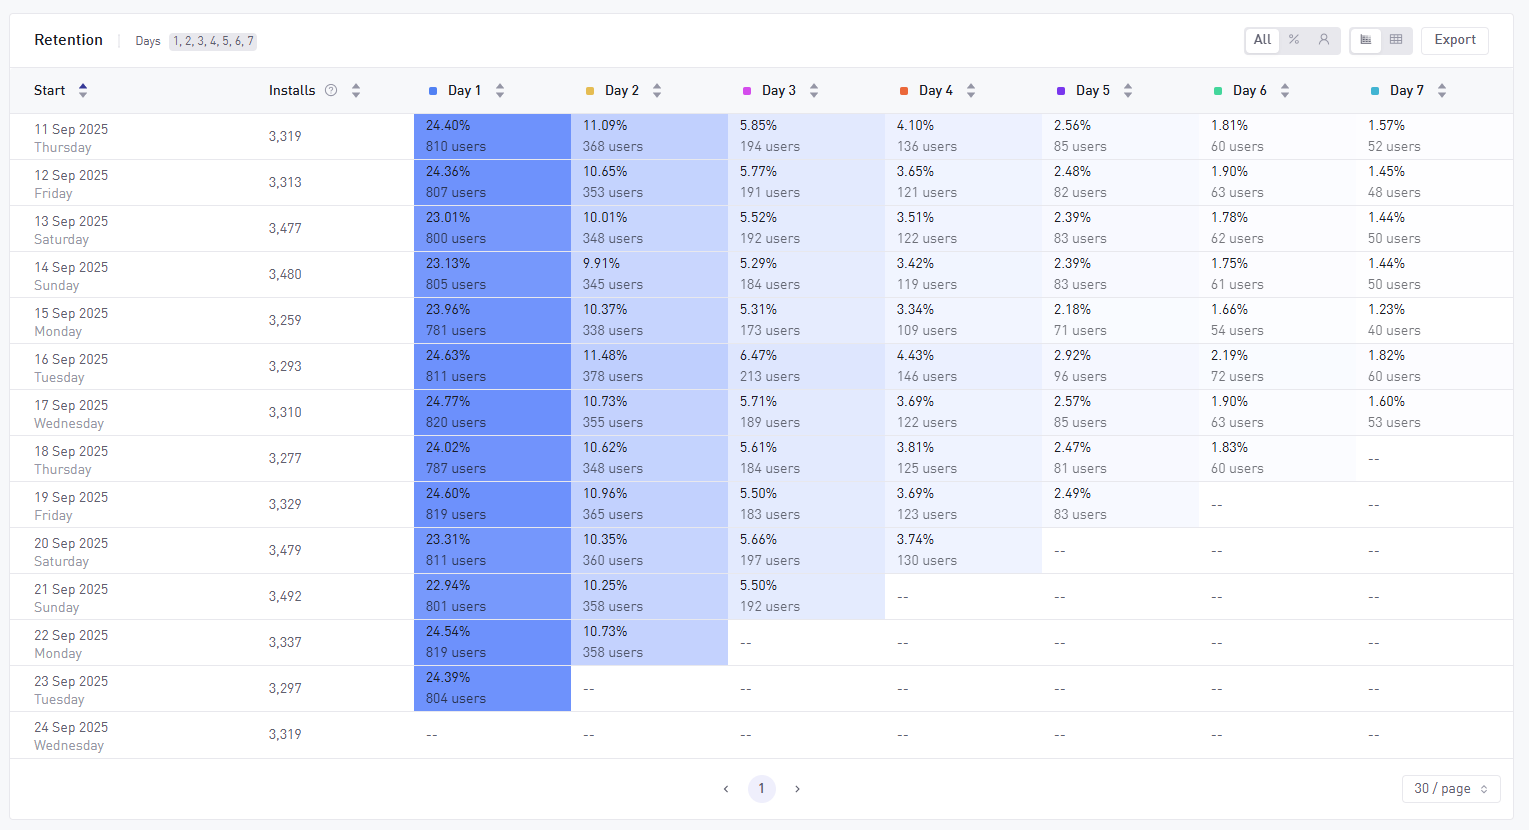
The Retention table shows:
- Rows: Start date + Users who triggered the Start condition on the specified date
- Columns: Return intervals (Day 1, Day 3, Day 30, etc.) as selected in Days Ahead option
- Cells: The Retention / Return Rate and user count