Predicted LTV (pLTV)
Overview
Predicted LTV (pLTV) reports the in-app purchase (IAP) lifetime value of your players and projects how that value grows into the future. It combines what your users have already spent with a prediction curve fitted to your historical data, so you can estimate where revenue is heading before a cohort has finished maturing.
The feature is for anyone forecasting monetization: user acquisition teams judging campaign payback, product teams sizing the impact of a change, and analysts modelling revenue. It currently covers IAP revenue only.
pLTV is a Labs feature. You can share feedback through our support channel.
What LTV and pLTV mean here
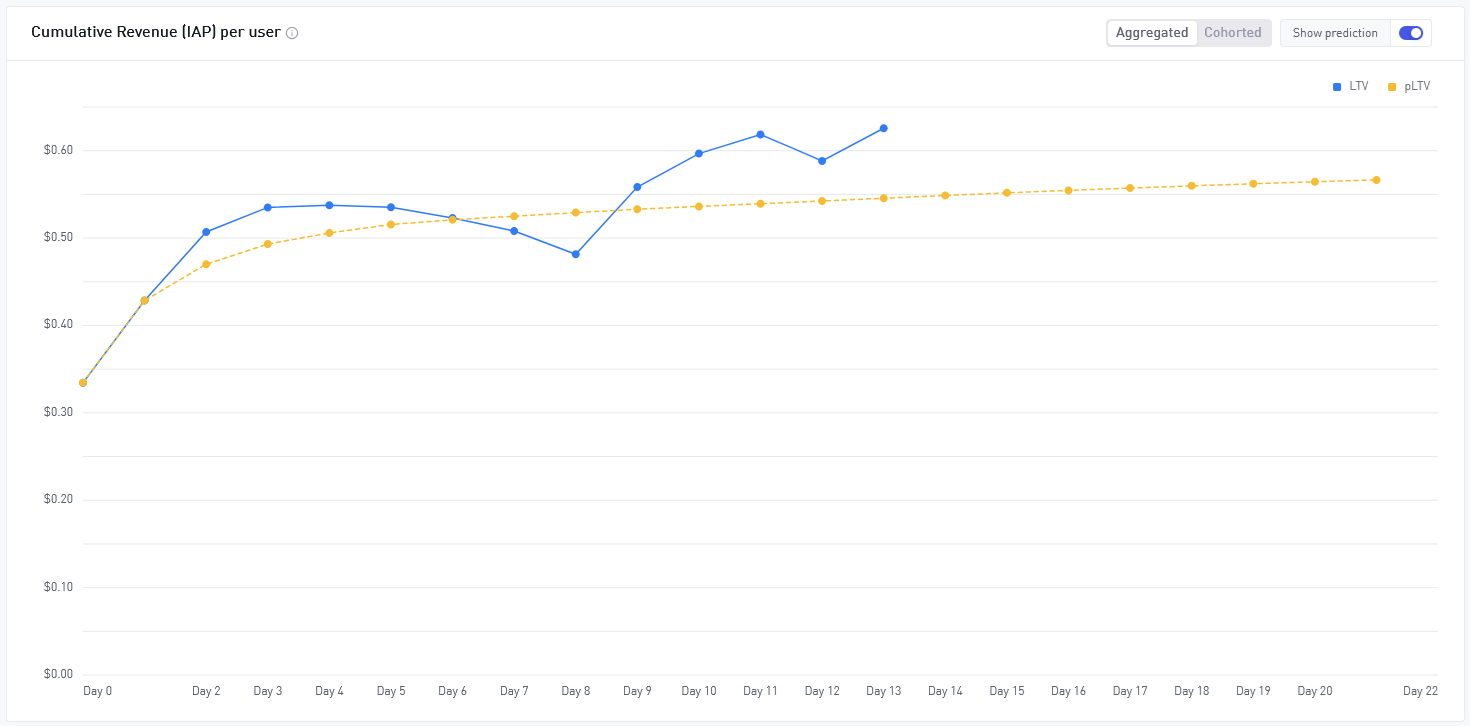
LTV is the metric Cumulative Revenue (IAP) per user. For a given day since install, it is the total IAP revenue generated by users up to that day, reported as the mean amount per user.
- LTV Day N is the mean cumulative IAP revenue per user from install through day N. For example, LTV Day 2 is the average total revenue per user across day 0, day 1 and day 2.
- pLTV is the predicted continuation of that curve for days a cohort has not reached yet.
The chart and table show measured LTV for past days and pLTV for on-going and future days.
Prerequisites
- A game that sends IAP data. pLTV is built on the Business event type. If your game does not send business events, the feature has nothing to report.
- A prediction curve. Predictions are driven by a prediction curve fitted to your historical LTV. When you open the feature, AnalyticsIQ generates a default curve automatically so data appears without extra setup. You can adjust the curve at any time in the curve editor.
If a curve cannot be automatically generated (for example, when there is not enough historical revenue data), the feature shows a Curve generation unsuccessful message with a button to open the curve editor. Adjust the settings there to establish a curve.
Reporting controls
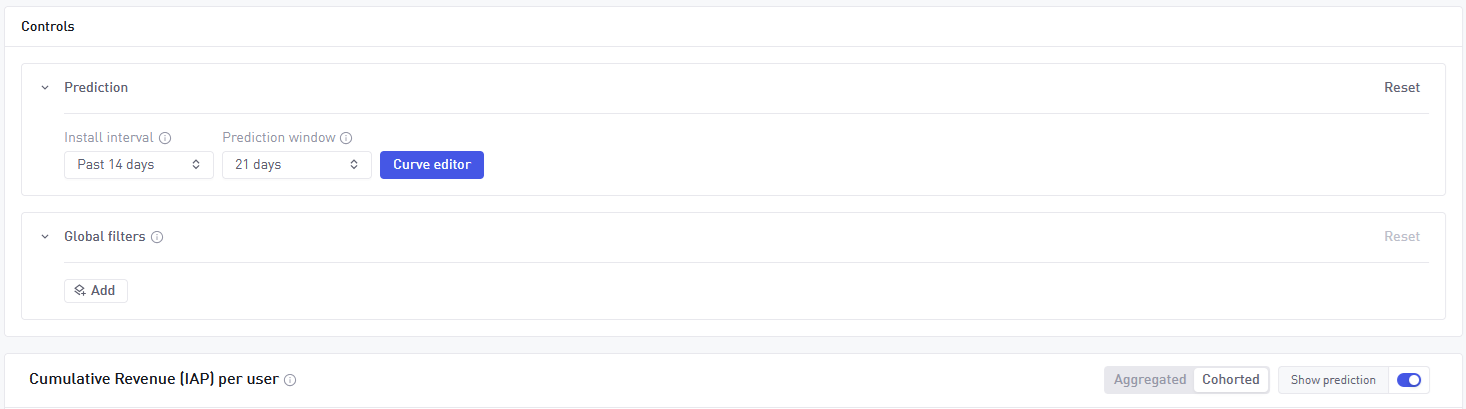
The controls at the top of the feature decide which cohorts are analyzed, how far ahead predictions run, and whether predictions are shown.
| Control | What it does |
|---|---|
| Install interval | Sets how much recent install history to analyze: Past 7 days, Past 14 days, Past 21 days or Past 28 days. Each daily install cohort in the interval is reported with its measured LTV and its pLTV. |
| Prediction window | Sets how many days ahead LTV is predicted, counting from today into the future: 7, 14, 21 or 28 days. The prediction window selection cannot exceed the amount of days used during prediction curve creation. |
| Curve editor | Opens the curve editor to review or change the prediction curve. |
| Show prediction | Toggles display of values on or off in both the chart and the table. Defaults to on. |
Show prediction
The Show prediction toggle changes what you see without reloading any data. Both the measured and predicted values are already loaded, and the toggle chooses which to display.
- On: past days show both measured LTV, and on-going and future days show pLTV.
- Off: only measured LTV is shown. On-going days are marked with a pulsating dot to signal that the day is still in progress, and future days are left empty.
Global filters
Global filters narrow the results to a segment of users, for example a single country. Add them from the controls area.
Only static filters are available. A static filter is one whose value does not change for a user after install, such as country. Filters that relate to install time (such as new users or days since install) or that can change over a user's lifetime are excluded, because they would distort the prediction.
Aggregated and cohorted views
You can view pLTV two ways using the report type selector.
| View | What it shows |
|---|---|
| Aggregated (default) | All install days in the interval are combined into a single LTV line and, when predictions are on, a single pLTV line. Best for a headline view of revenue over days since install. |
| Cohorted | Each daily install cohort is drawn as its own line (up to 28). Best for comparing how different install days perform and spotting cohorts that behave differently. |
The table follows the same selection: Aggregated shows a single set of values, and Cohorted splits the values by install day.
Reading the chart
The chart plots the metric over days since install.
- Y-axis: Cumulative Revenue (IAP) per user, shown in US dollars. It always starts at 0 and scales to the highest value in view.
- X-axis: days since install, from Day 0 up to the end of your prediction window.
- Solid line: measured LTV between past days.
- Striped line: pLTV leading into on-going or future days.
- Gaps: where a data point is missing, the line breaks rather than interpolating.
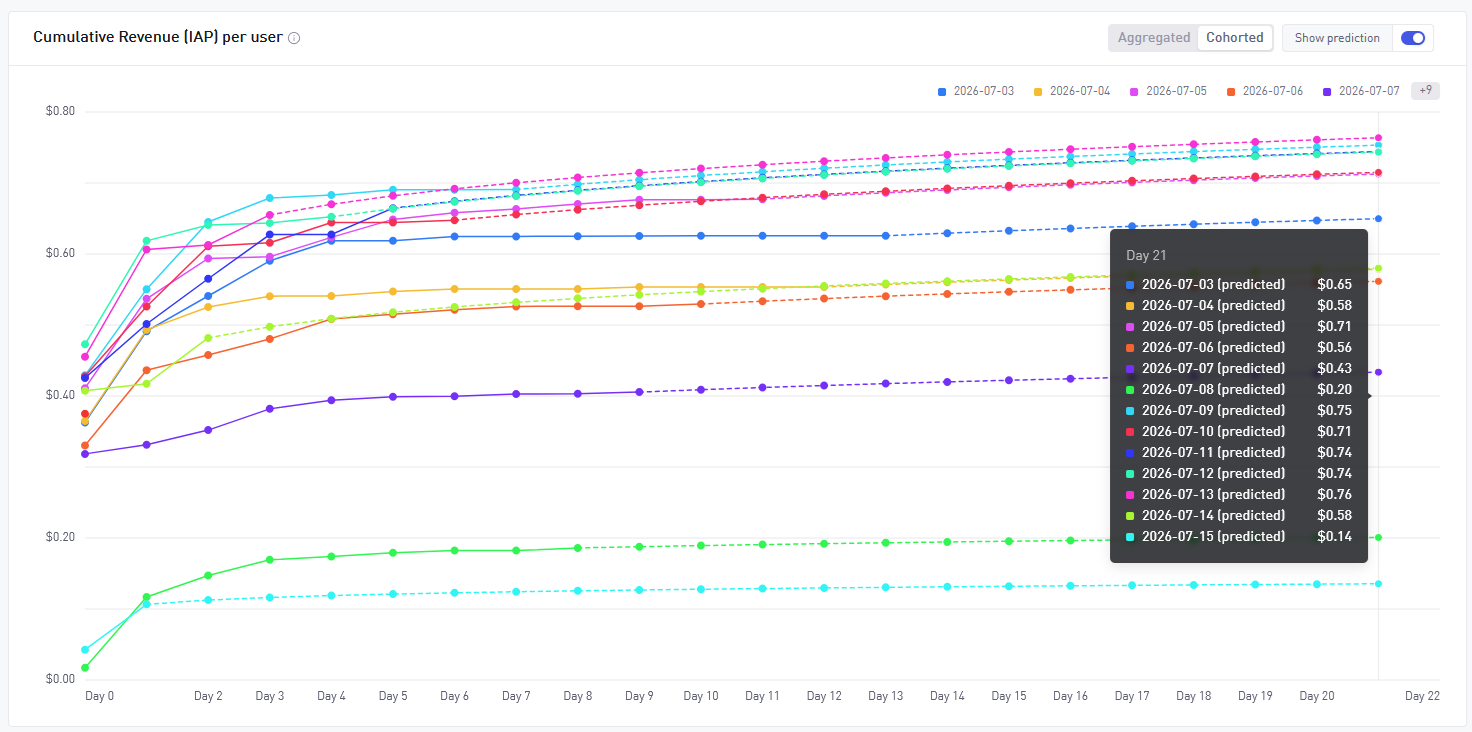
Hover any point to see its value. Predicted points are labelled (Predicted) in the tooltip so you can tell measured and estimated values apart.
The prediction curve starts from Day 1.
Reading the table
The table lists the metric by day since install. It shares the chart's controls for the heatmap, and for showing the metric, user counts, or both.
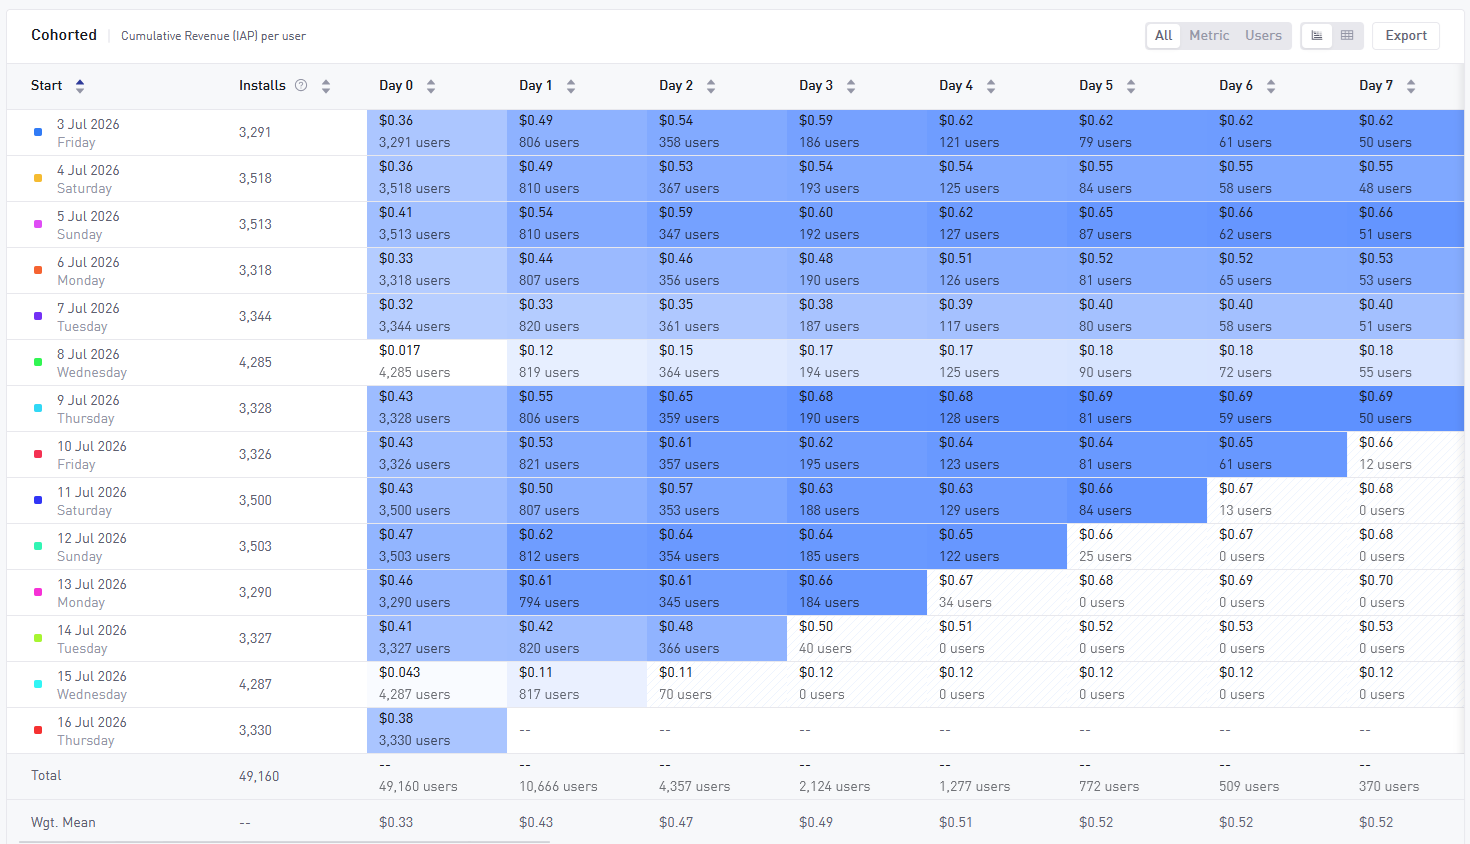
- Rows: days since install, sortable, starting from Day 0.
- Colors: in the cohorted view each install day keeps a consistent color across the chart and table.
- Heatmap: color highlighting to more easily identify peaks and dips, on by default.
- Predicted values: shown with a striped background so they stand out from measured values. With Show prediction off, predicted columns are hidden and future days show as
--. - Footer: shows summary values such as totals and weighted means.
- Exporting: Export the table to CSV from the table controls, the same way as elsewhere in AnalyticsIQ. When the footer is enabled, its summary values are included in the export.
Predicted data points do not have a user count. When you display user counts with predictions on, predicted cells are empty because no users have been measured for those days yet.
Adjusting the prediction curve
The curve editor is a fullscreen view for reviewing and regenerating the prediction curve. Open it from the Curve editor button in the reporting controls.
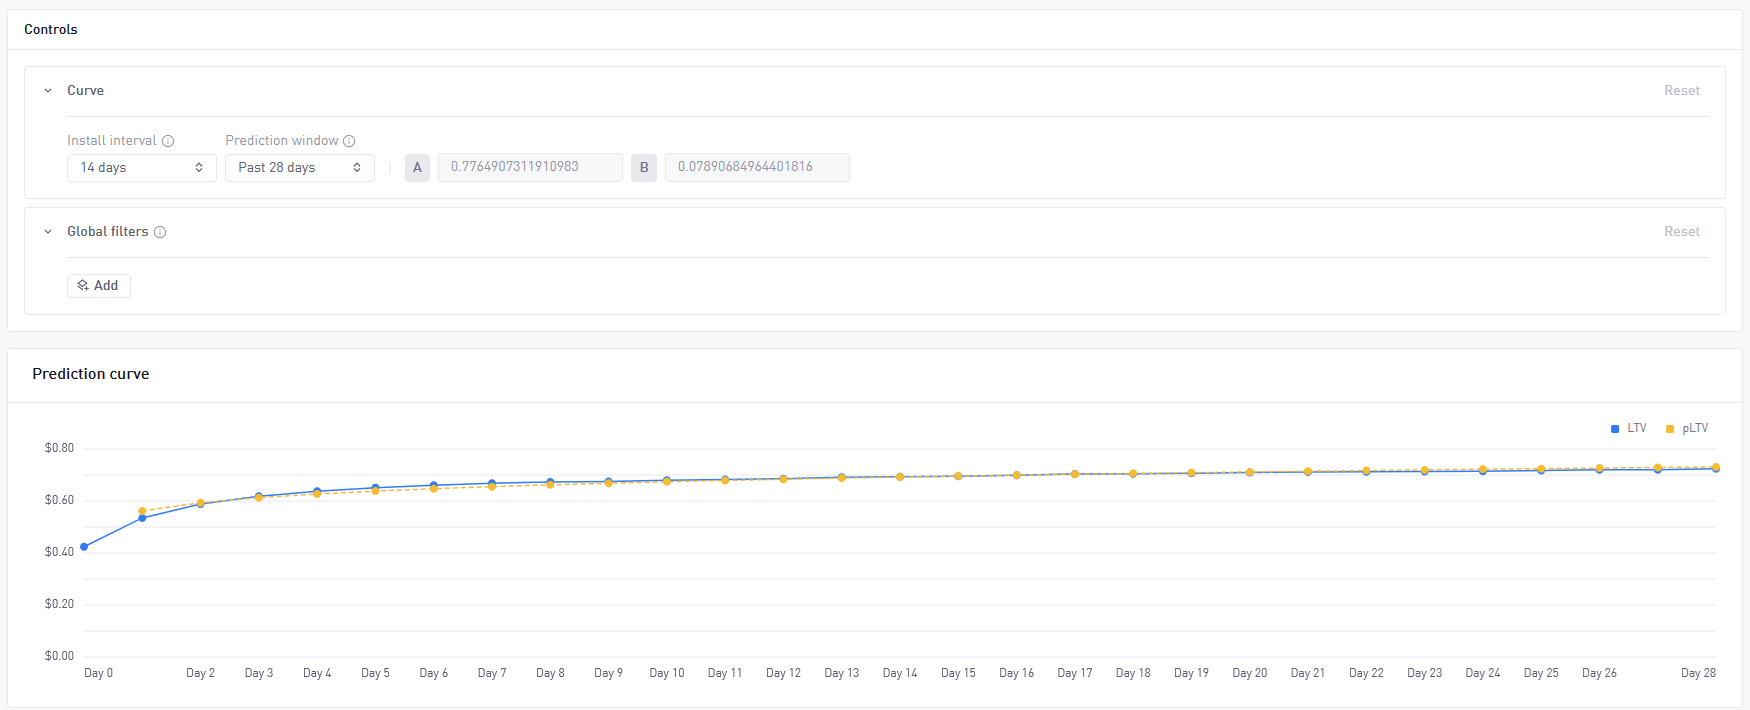
The curve is a power function fitted to your measured historical LTV. The chart shows two lines: your measured LTV and the fitted prediction curve. Once you apply a curve, it is used to predict future LTV in the reporting view.
| Control | What it does |
|---|---|
| Install interval | The window of past install days used to measure historical LTV: 7, 14, 21 or 28 days. |
| Prediction window | The number of days after install used for the historical LTV analysis that fits the curve: 7, 14, 21 or 28 days. This value becomes the maximum prediction window available in the reporting view. |
| Coefficient (a) and Exponent (b) | The two parameters of the fitted power function, shown read-only. You can select and copy them if you need the exact values. |
| Reset | Returns the controls to their defaults and reloads. |
| Apply | Stores the curve and loads pLTV in the reporting view. Disabled while loading and when a curve cannot be generated. |
| Close | Leaves the editor without changing the applied curve. |
Global filters work here as they do in the reporting view: static filters only.
If there is no historical data to fit, the editor shows Curve generation unsuccessful and Apply stays disabled. You can still change the controls and try again, or close the editor. The coefficient and exponent show -unspecified- until a valid curve is generated.
Best practices
- Treat predictions as estimates. pLTV extends a fitted curve. It is most reliable close to the measured range and less certain the further ahead it reaches.
- Match the prediction window to your decision. If you regularly forecast 28 days out, generate the curve with a 28 day prediction window so that option is available in reporting.
- Compare cohorts before trusting a single number. Use the cohorted view to check whether recent install days behave consistently. A few unusual cohorts can pull an aggregated line up or down.
- Filter to comparable users. Use global filters, such as country, when a segment monetizes very differently from your overall player base.