Error Charts
The Error Chart view allows you to analyze visual representations of:
- Errors (mean per user) - overall average count of errors per user.
- Error users - unique users that have experienced at least one error event.
- Errors (group by top 10 devices) - count of each error per device basis.
- Error Users (group by severity) - unique users that have experienced different severities.
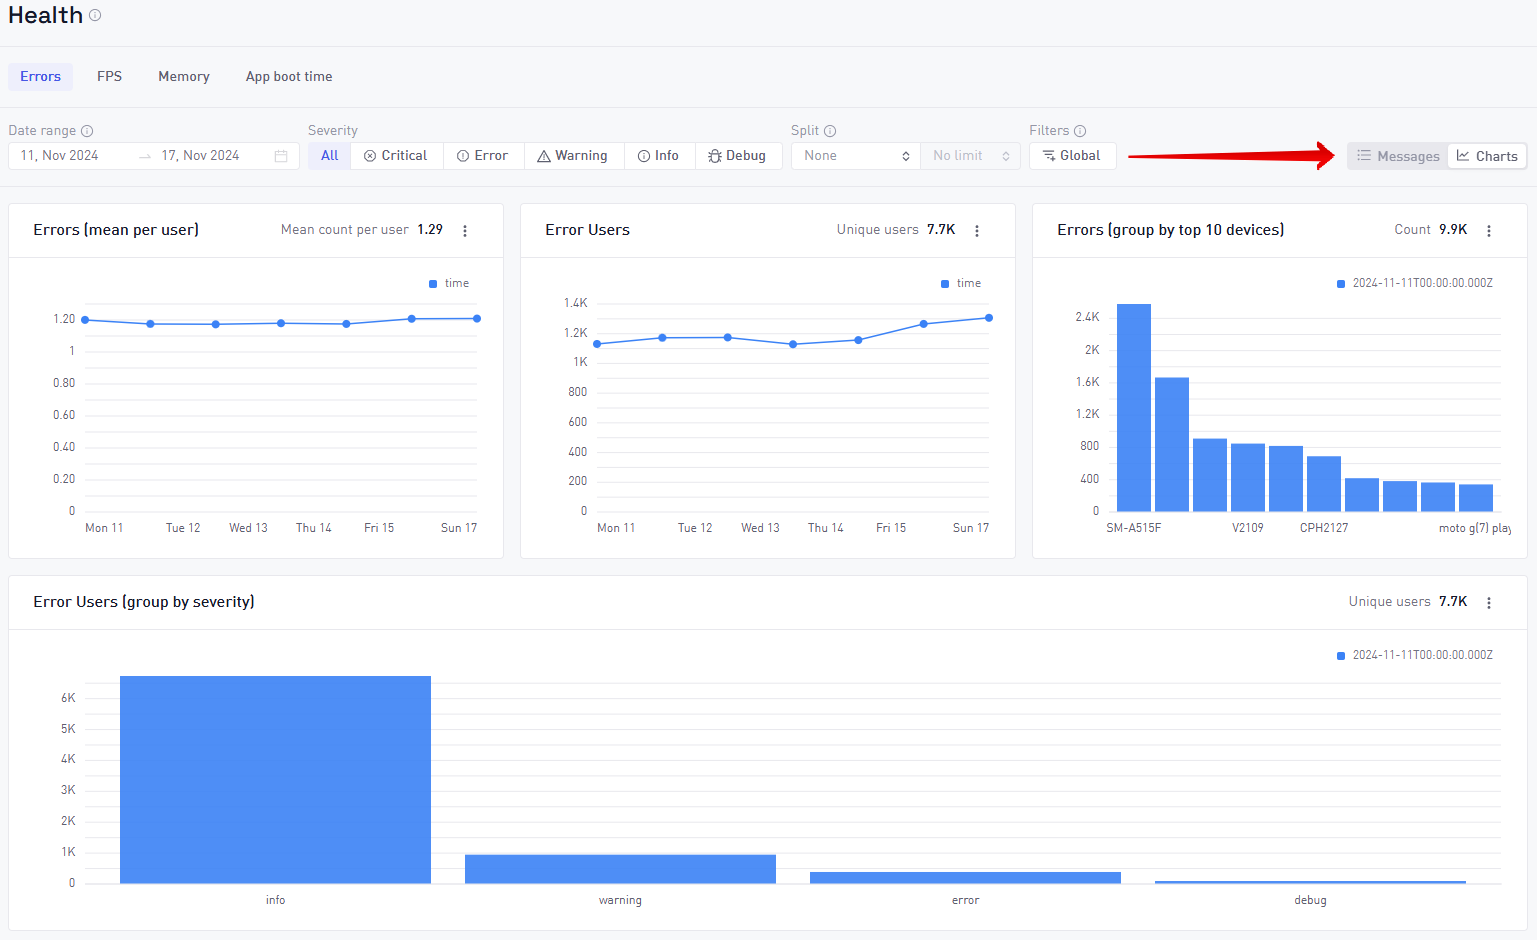
To navigate back and forth between Error Messages and Charts, use the buttons highlighted by the red arrow.
Filter by severity
By using the menu at the top of the page you can filter the errors in terms of severity, whether they are critical errors, regular errors, warnings, information messages, or debug messages that you are tracking.

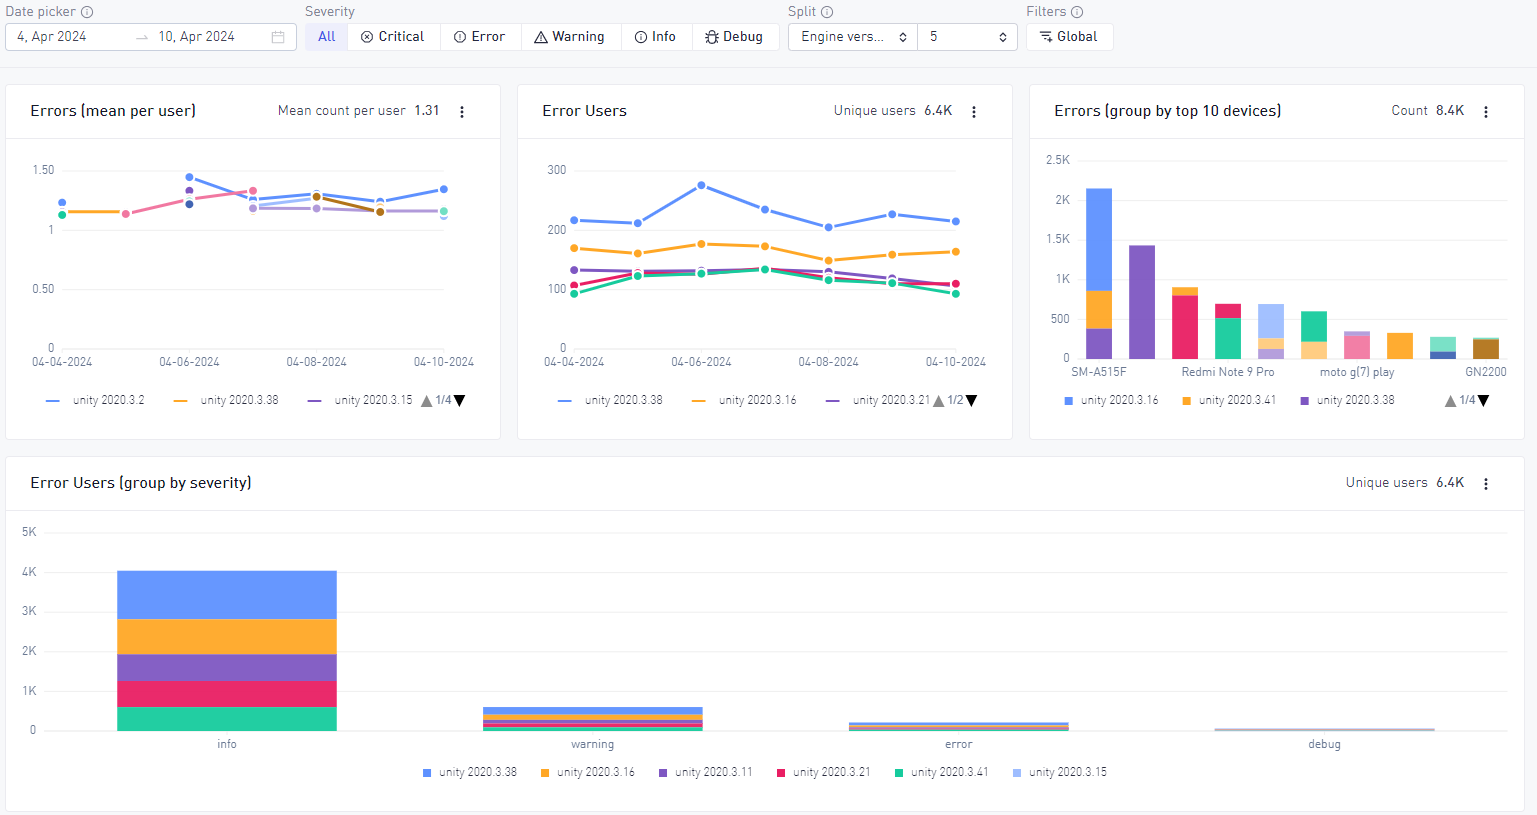
Split feature
To the right of the Severity filter you can see the split option.

You can split by the following:
- Build
- First build
- SDK version
- Engine version
- Severity
- OS version
- Manufacturer
- Device
- Connection type
- Country code
The number that you can see after the split is the limit of the split. If you limit it to 5 for "Engine Version", and look at the Error Users widget, then only the Top5 engine versions per day (for the metric Error Users) will be displayed.
Global filters
In addition to splitting the data you can also use global filters to segment the data even more.

Currently the tool supports the following global filters:
- Country code
- Build
- First build
- Days since install
- Connection type
- Consent status (only iOS)
- New or returning users
- Custom properties
- Device
- Engine version
- Manufacturer
- OS version
- Platform
- SDK version
- Paying users
Select any filter you would like and the visualization will change accordingly.
Global filters and Split are often combined to compare only specific values like build or country. For example selecting the last 3 builds as a Global filter and also build as a Split
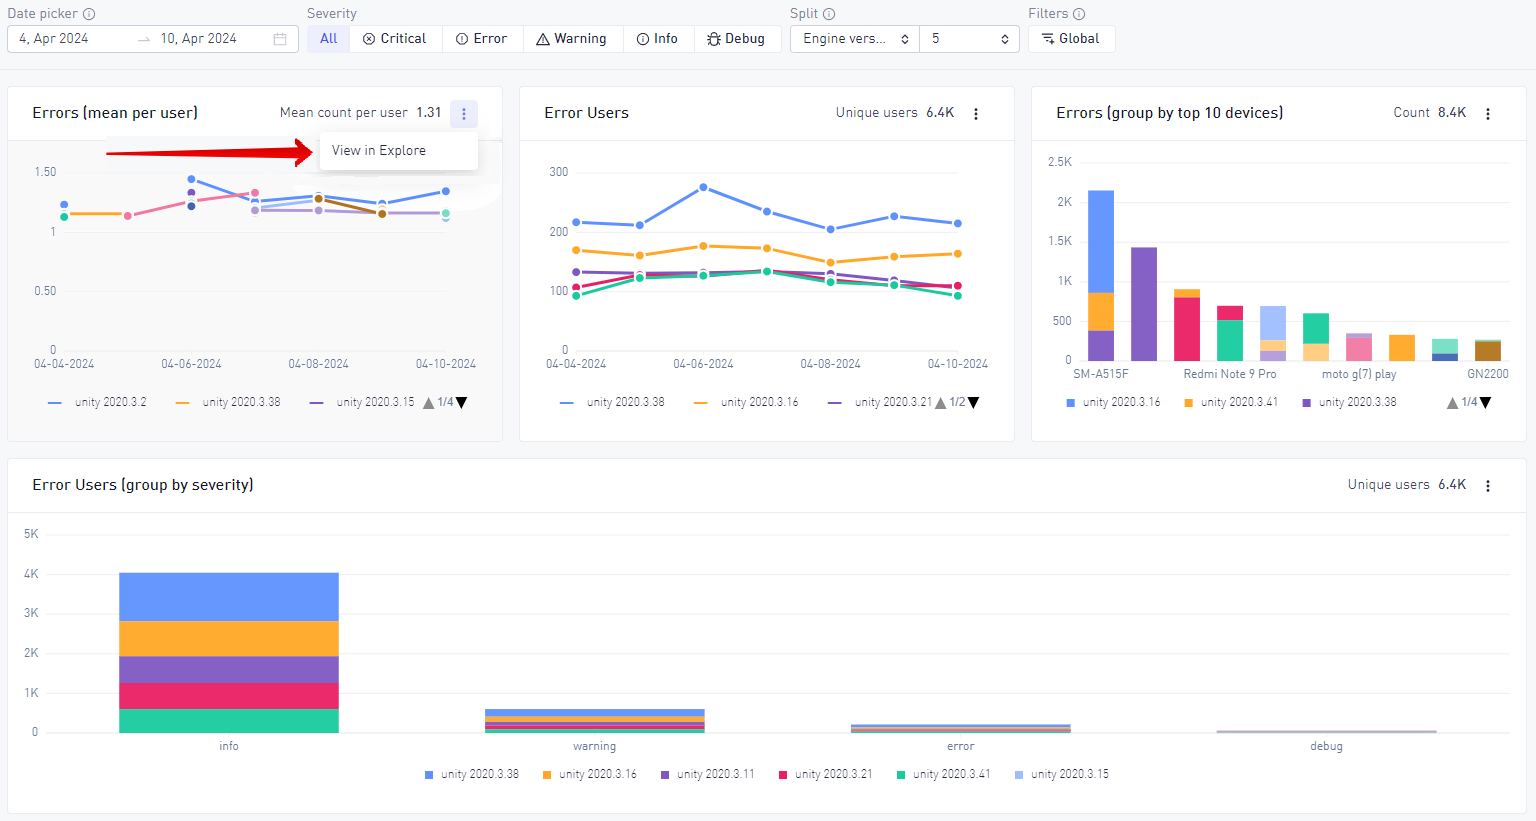
Transition to Explore Tool
It is possible to transition to the Explore tool from any of these widgets to visualize the data in more detail. Any active split or filter is also carried over.