Error Messages
The default view for the Health feature will be Error Messages.
This view is dedicated to the listing of specific error messages to help understand what went wrong in the app, in order to address the issues.
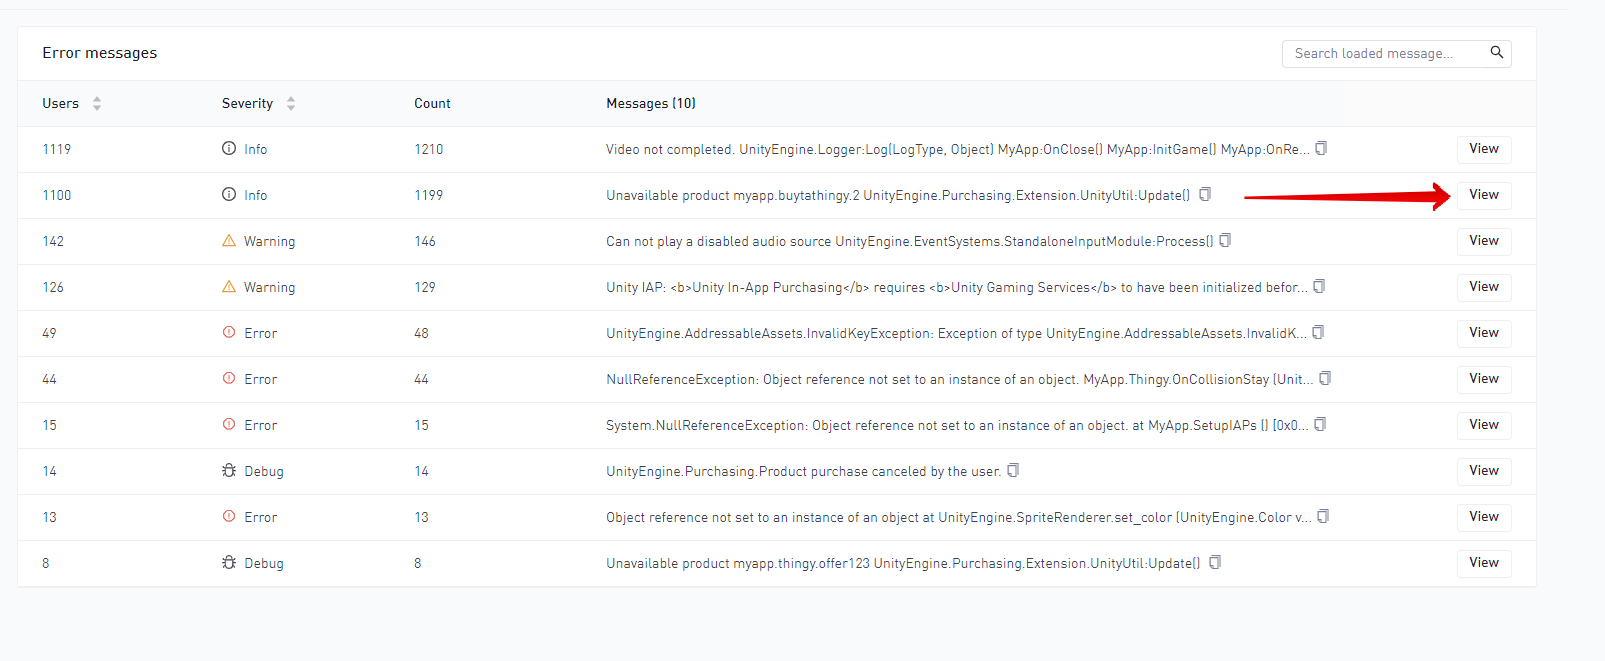
The list will load Top 1000 unique errors for the period selected sorted by the count of users affected.
Using the search input will only search the loaded values in the table.
However defining a filter (Severity or Global filter) will reload the query and can therefore be used to narrow the list to specific builds.
The split functionality is unavailable on this view as it applies to charts only.
View error stacktrace messages
It is possible to inspect a specific error stacktrace by clicking the View button highlighted by the red arrow in the image above. This fullscreen view shows the full message to easily copy.
It will also display widgets for Errors split by top 10 builds and Errors per user split by top 10 builds to help understand when this error was introduced. Any potential filters applied from the message list view is also applied when viewing a single error.
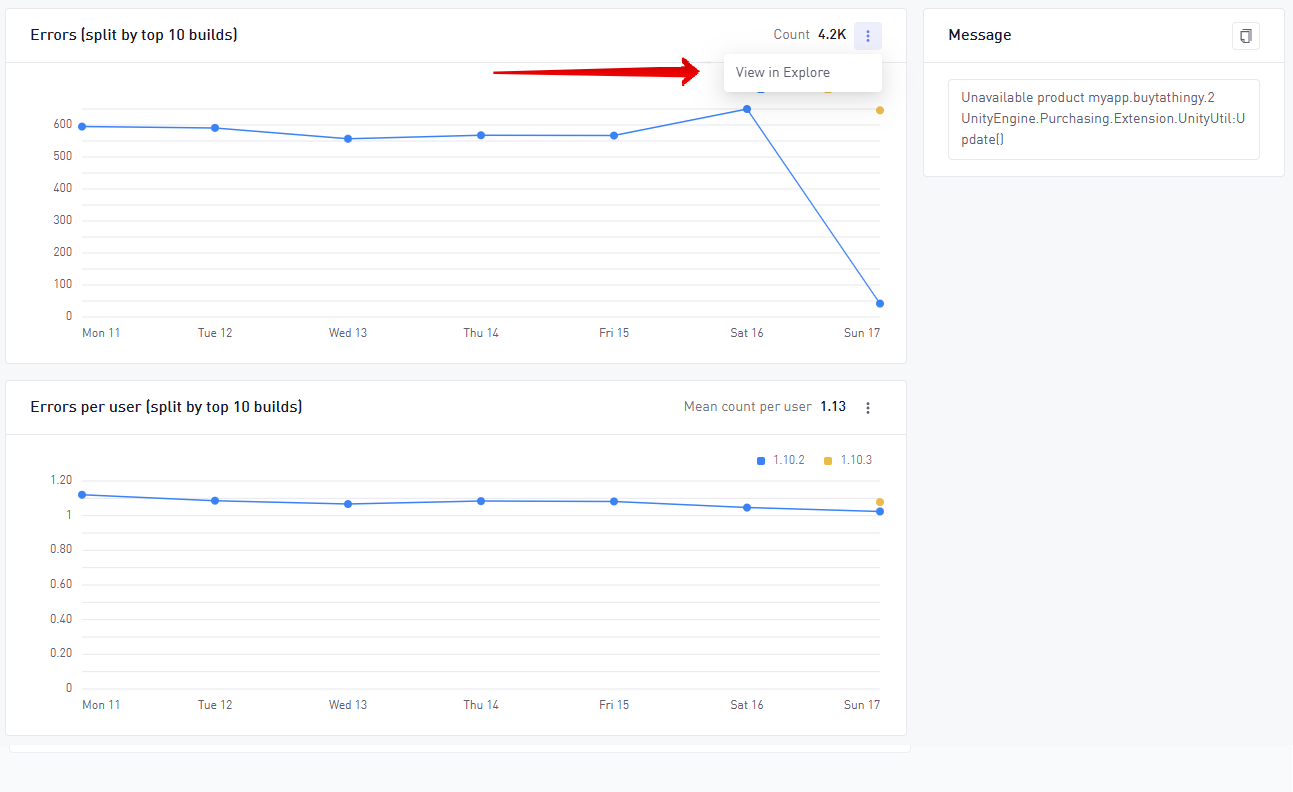
In addition it’s possible to transition to the Explore tool from these widgets to view the error query in more detail.