FPS
This feature enables you to view how many frames per second your app is recording and visualizes the distribution of FPS samples sent. Low FPS can lead to player frustration and churn, and it is imperative to monitor. Samples are collected and averaged every second during sessions, longer sessions will therefore send more samples than shorter sessions.
The following charts are available on this view:
- FPS Chart - Distribution of samples sent for each frame per second (FPS). X-axis shows count of samples sent per FPS, samples are collected and averaged every second.
- Experience Chart - Shows the median FPS from your application over the past 30 days, on the scale of 1-120 FPS.
Range filtering
By using the slider you can set the minimum and maximum FPS values you would like to include in your analysis. Note that this setting only applies to the chart. FPS range is from 1 to 120.

Buckets
By changing the number of buckets you can increase or decrease the granularity of grouping to better understand the distribution of values. Note that this setting only applies to the chart. The default bucket value for FPS is 10, and it can go from 1 to 120.

Instead of seeing all the data distribution over 120 data points on a chart, where each datapoint represents samples sent per single FPS range, it will be aggregated into 12 data points where each points shows the combined event samples for 10 FPS ranges
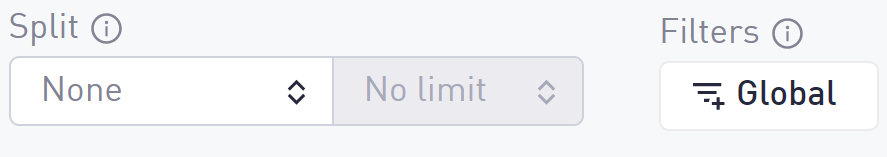
Other functionality
In addition to changing the FPS range and Buckets, you can also split and use global filters to segment your data even more. See the list of global filters here